Identify whether a problem is CPU, memory, I/O, or network bound
Generate repeatable load to validate hardware or reproduce issues
Turn raw support bundles into faster, more readable diagnostic reports
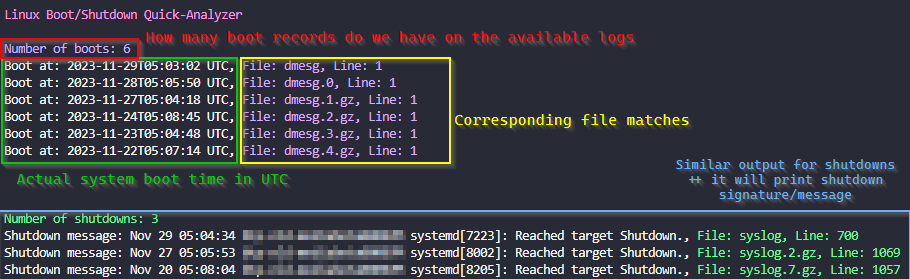
1.1 - Linux Boot/Shutdown Quick-Analyzer
Parse Linux boot and shutdown events from system and serial console logs.
What is Linux Boot/Shutdown Quick-Analyzer and why do you need it?
The Linux Boot/Shutdown Quick-Analyzer is a Python script that analyzes Linux boot and shutdown logs.
It makes it easy to find boot and shutdown events in system logs, providing information such as the number of boot and shutdown events, along with the timestamp, filename, and line number for each event.
How to run it
You need to have Python 3 installed on your machine.
To use the script, navigate to the directory containing your logs (usually /var/log) and run the following command:
# Make sure you are working inside your system logs dircd /var/log
# Execute the scriptcurl https://raw.githubusercontent.com/samatild/linuxrebootcheck/main/linuxrebootcheck.py | python3
Special arguments for special Serial Console logs!
What about those logs that are not in the usual format?
To analyze Serial Console file, you need to download the script and use the –serial-console-log argument followed by the filename:
Overall, the Linux Boot/Shutdown Quick-Analyzer is a useful tool for analyzing Linux boot and shutdown logs. It provides a quick and easy way to find boot and shutdown events in system logs, making it easier to troubleshoot issues and identify potential problems. If you’re looking for a simple and efficient way to analyze your system logs, give it a try!
1.2 - How Antivirus Software Can Prevent Linux Boot: Troubleshooting Guide
Learn how antivirus software can interfere with Linux system boot, including readonly filesystem problems, LSM conflicts, and CrowdStrike Falcon Sensor troubleshooting.
Understanding Antivirus Boot Interference
Antivirus software, while crucial for system security, can sometimes interfere with the Linux boot process. This occurs when security modules become overly aggressive during system initialization, potentially causing boot failures, readonly filesystem mounts, or service startup issues.
Common Symptoms
System fails to boot completely
Filesystem mounts as readonly (ro) instead of read-write (rw)
Critical services fail to start
Boot hangs at specific points
SELinux/AppArmor policy violations during boot
Filesystem Readonly Issues
One of the most common problems occurs when antivirus software causes the root filesystem to mount readonly. This prevents the system from writing critical boot files and can halt the initialization process.
Root Cause Analysis
Antivirus software often implements filesystem integrity checking or real-time scanning that can interfere with:
[   15.678901] systemd[1]: Failed to start Local File Systems.
[   15.678901] systemd[1]: Dependency failed for Remote File Systems.
[   15.678901] mount[1234]: mount: / cannot be mounted read-write
Recovery Steps
Boot into recovery mode or single-user mode:
# At GRUB menu, press 'e' to edit# Add 'single' or 'recovery' to kernel parameterslinux /boot/vmlinuz-... ro single
Check filesystem integrity:
# Run filesystem checkfsck -f /dev/sda1
# If issues persist, check dmesg for antivirus-related messagesdmesg | grep -i "antivirus\|security\|scanner"
Temporarily disable antivirus during boot:
# For systemd-based systems, mask the service temporarilysystemctl mask antivirus-service-name
systemctl reboot
Linux Security Modules (LSM) Conflicts
Linux Security Modules (LSM) provide the framework for security subsystems like SELinux, AppArmor, and various antivirus solutions. When multiple LSMs are active or improperly configured, they can conflict during boot.
LSM Architecture Overview
LSM hooks into the kernel at critical points:
Process creation and execution
File access operations
Network operations
Memory management
Common LSM Boot Conflicts
SELinux + Antivirus LSM:
Both may attempt to enforce policies on the same resources
Race conditions during policy loading
Conflicting access decisions
AppArmor Profile Loading:
[FAILED] Failed to load AppArmor profiles
[FAILED] apparmor.service: Main process exited, code=exited, status=1/FAILURE
CrowdStrike Falcon Sensor is a common enterprise antivirus solution that can cause boot problems when misconfigured. The sensor requires proper licensing and network connectivity to function correctly.
The Critical Error
When CrowdStrike Falcon Sensor fails during boot, you may see:
[FAILED] Failed to start CrowdStrike Falcon Sensor.
This failure can cascade into other issues:
System may continue booting but without security protection
Network services may fail if the sensor blocks them
Filesystem operations may be restricted
Root Causes
Missing or invalid license
Network connectivity issues during sensor initialization
Conflicting security policies
Outdated sensor version
Improper installation or configuration
Immediate Fix: Masking the Service
When the CrowdStrike service fails and blocks system access, you can temporarily mask it to allow the system to boot:
# Check the exact service namesystemctl list-units --all | grep -i crowdstrike
# Mask the service to prevent automatic startupsudo systemctl mask falcon-sensor
# Reboot the systemsudo systemctl reboot
Permanent Solutions
Verify licensing:
# Check CrowdStrike status/opt/CrowdStrike/falconctl -g --cid
# If CID is missing, contact your administrator
Update sensor:
# Update CrowdStrike sensor/opt/CrowdStrike/falconctl -s --update
# Or reinstall if update fails
Network configuration:
# Ensure DNS resolution worksnslookup falcon.crowdstrike.com
# Check proxy settings if applicableenv | grep -i proxy
# Update antivirus definitionsantivirus-update-command
# Monitor system logs for early warningslogwatch --service antivirus
Monitoring and Alerting
Set up log monitoring for antivirus-related errors
Configure alerts for service failures
Regular health checks of security components
Documentation of emergency procedures
Conclusion
Antivirus software is essential for Linux security but requires careful configuration to avoid boot interference. Understanding LSM interactions, filesystem behavior, and specific tool requirements (like CrowdStrike Falcon Sensor) is crucial for maintaining system stability.
When issues occur, systematic troubleshooting—starting with log analysis and service isolation—usually reveals the root cause. Temporary fixes like service masking provide immediate relief while permanent solutions address underlying configuration problems.
Remember: security and stability aren’t mutually exclusive with proper planning and monitoring.
1.3 - How to Troubleshoot Linux Performance — Field Playbook
Learn how to troubleshoot Linux performance issues with a practical field playbook for live triage, intermittent problems, vmstat, iostat, pidstat, sar, and more.
A field-ready reference for Linux performance investigations — keep it open in a second terminal.
How to use this playbook
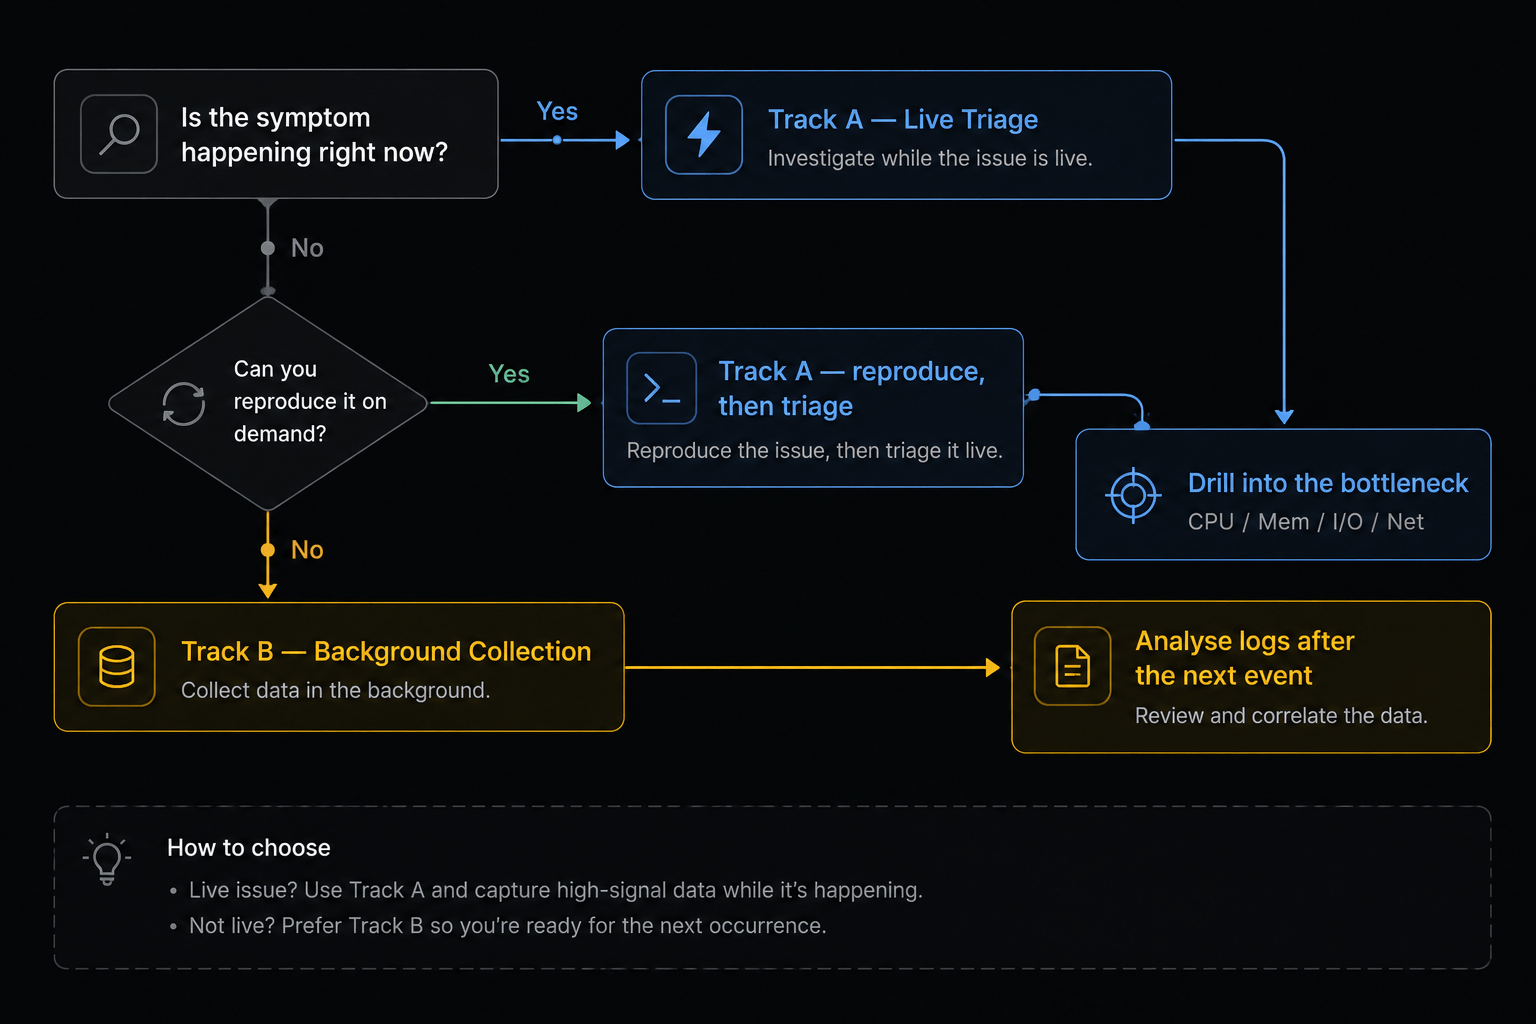
Linux performance problems split cleanly into two very different investigations, and picking the wrong one wastes hours:
Situation
Track
What you do
The problem is happening right now (or you can reproduce it on demand)
Track A — Live Triage
Interactive tools, sample at 1s intervals, follow the bottleneck
The problem is intermittent / random (happens overnight, once a week, only under load you can’t reproduce)
Track B — Background Collection
Arm continuous loggers before the next occurrence, then mine the logs afterwards
Rule of thumb
If you can’t reproduce it, do not keep staring at top. Stop, deploy collectors, walk away, and analyse later. Otherwise you’ll miss the event every single time.
Recommended companion: LinuxAiOPerf
Before diving into individual tools, there is a tool worth installing on every box where you investigate performance: LinuxAiOPerf — an all-in-one Linux performance data collector that wraps most of what’s described below into a single, controllable session.
It is particularly powerful for Track B (Background Collection) because it:
Starts and stops vmstat, iostat, pidstat, mpstat, sar, ps, /proc snapshots, and more with a single command
Saves everything to a timestamped directory ready to attach to a ticket or share with engineering
Handles long unattended runs without filling the disk
Produces output that is easy to diff between “good” and “bad” windows
Recommendation
Use LinuxAiOPerf as your default collector. Reach for raw vmstat / iostat / pidstat only when you need something it does not capture, or when you want to watch something live in a second terminal.
# Downloadwget https://raw.githubusercontent.com/samatild/LinuxAiOPerf/main/build/linux_aio_perfcheck.sh
# Make executablechmod +x linux_aio_perfcheck.sh
# Run (interactive mode)sudo ./linux_aio_perfcheck.sh
Track A — Live Triage
You’re on the box, the problem is visible. Goal: identify the dominant bottleneck (CPU, memory, I/O, or network) in under 60 seconds, then drill in.
The 60-second triage
Run these in order. Stop as soon as one clearly points at a culprit.
# 1. Overall load and "is anything obviously wrong?"uptime
dmesg -T | tail -50
# 2. CPU + run queue + swap + I/O wait, sampled every secondvmstat 15# 3. Per-CPU breakdown (is one core pegged? is it user, system, or iowait?)mpstat -P ALL 13# 4. Top processes by CPU and memorypidstat -u 13pidstat -r 13# 5. Disk pressureiostat -xz 13# 6. Memory truthfree -h
Reading the first signs
Signal in vmstat 1
Likely bottleneck
r consistently > number of CPUs
CPU saturation (run queue)
b > 0 with high wa
I/O bottleneck (processes stuck in D-state)
si / so > 0
Memory pressure — swapping
sy very high (>30%)
Kernel work — syscalls, contention, interrupts
us very high with low id
User-space CPU — application is the culprit
ps — Process snapshot
ps aux # All processes: user, CPU, MEM, state, commandps auxf # Same, with ASCII process treeps -eo pid,ppid,stat,comm # Custom columns: PID, parent, state, nameps -eo pid,ppid,stat,wchan,args # Add wait-channel (what kernel fn it's blocked in)# Filter by nameps aux | grep nginx
# Show a specific PIDps -p <PID> -o pid,ppid,stat,vsz,rss,comm
# Find processes in bad statesps aux | awk '$8 ~ /^[DZ]/'# D-state (uninterruptible) or zombies
STAT column decoded
Code
Meaning
R
Running or runnable (on CPU or in run queue)
S
Interruptible sleep (waiting for event — can receive signals)
D
Uninterruptible sleep (waiting on I/O — cannot be killed)
T
Stopped (SIGSTOP or debugger)
Z
Zombie (exited, waiting for parent to call waitpid)
+
Foreground process group
s
Session leader
l
Multi-threaded
D-state processes are a red flag
They’re blocked in the kernel, usually on I/O. Check /proc/<PID>/wchan to see what they’re waiting on.
/proc — Live kernel state
# Process status (state, memory, threads, signals)cat /proc/<PID>/status
# Key fieldsgrep -E 'State|VmSize|VmRSS|VmSwap|Threads|SigCgt' /proc/<PID>/status
# What kernel function is the process sleeping in?cat /proc/<PID>/wchan
# Full command linecat /proc/<PID>/cmdline | tr '\0'' '# Open file descriptorsls -la /proc/<PID>/fd
# Memory map (virtual address space)cat /proc/<PID>/maps
# Detailed per-region memory accountingcat /proc/<PID>/smaps_rollup
# System-wide memorygrep -E 'MemTotal|MemAvailable|SwapTotal|SwapFree' /proc/meminfo
Key /proc/meminfo fields
Field
Meaning
MemTotal
Total physical RAM
MemAvailable
RAM available for new allocations (use this, not MemFree)
MemFree
RAM not used at all (excludes reclaimable cache)
Cached
Page cache (reclaimable)
SwapTotal / SwapFree
Swap space
Dirty
Pages waiting to be written to disk
vmstat — System-wide memory + CPU
vmstat 1# Update every 1 second (forever)vmstat 130# 30 samples, 1 second apartvmstat -s # Summary totalsvmstat -m # Slab allocator stats
procs --------memory--------- --swap- ---io-- -system- ------cpu-----
 r  b   swpd   free  buff cache  si  so   bi   bo   in   cs us sy id wa
Column
Meaning
r
Processes in run queue (waiting for CPU)
b
Processes in uninterruptible sleep (D state)
swpd
Virtual memory used (kB)
free
Idle memory (kB)
si
Swap-in rate (kB/s — pages read from disk)
so
Swap-out rate (kB/s — pages written to disk)
bi / bo
Blocks in/out per second
us / sy / id / wa
CPU user / kernel / idle / iowait %
Rule of thumb
si / so > 0 means you’re swapping. wa > 20% means I/O is the bottleneck. r > CPU count = run-queue saturation.
pidstat — Per-process statistics (sysstat)
# Install sysstat if neededsudo apt-get install -y sysstat # Debian/Ubuntusudo dnf install -y sysstat # RHEL/Fedorasudo zypper install -y sysstat # SUSEpidstat -u 1# CPU usagepidstat -r 1# Memory (RSS, VSZ)pidstat -d 1# Disk I/O per processpidstat -w 1# Context switchespidstat -urd 1# All metrics combinedpidstat -p <PID> -u 1# Filter for one PID
pidstat -u columns (CPU)
Column
Meaning
%usr
CPU time in user space
%system
CPU time in kernel
%guest
CPU time in virtual machine
%wait
Time waiting for CPU (high = CPU contention)
%CPU
Total CPU usage
pidstat -r columns (Memory)
Column
Meaning
minflt/s
Minor page faults per second (no disk I/O)
majflt/s
Major page faults per second (disk read required)
VSZ
Virtual memory size (kB) — reserved, not necessarily in RAM
RSS
Resident Set Size (kB) — actually in physical RAM
%MEM
RSS as % of total RAM
Key insight
RSS is real memory usage. VSZ can be much larger — virtual memory is cheap until you actually touch the pages.
top keys: P sort by CPU, M sort by memory, 1 toggle per-CPU, d change refresh, k kill PID, q quit.
Tip
Use available, not free, in the free output — available includes reclaimable cache. Plain free is misleading on Linux.
strace & lsof — Drilling into a single process
# What syscalls is this process making right now?strace -p <PID>
# Count syscalls (summary mode)strace -c -p <PID> # Ctrl-C after a few seconds# Trace specific syscalls onlystrace -e trace=read,write,open,openat,close -p <PID>
# Timestamps + time per syscallstrace -tt -T -p <PID>
# Who has this file/socket open?lsof -p <PID>
lsof -i :443
lsof /var/log/syslog
Warning
strace slows the target process down significantly. Don’t leave it attached to a production-critical process for long.
kill — Sending signals
kill <PID> # SIGTERM (15) — polite requestkill -KILL <PID> # SIGKILL (9) — cannot be caughtkill -STOP <PID> # Freeze (SIGSTOP — cannot be caught)kill -CONT <PID> # Resumepkill nginx # Kill by namekill -l # List all signals
Signal
Number
Catchable
Meaning
SIGTERM
15
✅
Graceful shutdown request
SIGKILL
9
❌
Immediate kill
SIGSTOP
19
❌
Freeze process
SIGCONT
18
✅
Resume
SIGINT
2
✅
Interrupt (Ctrl-C)
SIGHUP
1
✅
Hangup / reload config
SIGUSR1 / SIGUSR2
10 / 12
✅
Application-defined
Track B — Background Collection
The symptom is intermittent. You won’t catch it live. The goal is to arm collectors before the next event and then go back and analyse the logs after it happens.
The golden rule
The golden rule
Start collecting before the problem reproduces, not after. If a customer says “it happened at 03:14 last night,” your only chance of catching the next one is data that was already being written at 03:13.
Option 1 (recommended): LinuxAiOPerf
# Downloadwget https://raw.githubusercontent.com/samatild/LinuxAiOPerf/main/build/linux_aio_perfcheck.sh
# Make executablechmod +x linux_aio_perfcheck.sh
# Run (interactive mode)sudo ./linux_aio_perfcheck.sh
This is the path of least resistance for an unattended overnight collection. One command, one output directory, everything correlated by timestamp.
Option 2: Manual sysstat + tee loggers
If you can’t install anything new, the classic sysstat tools work fine. Run each one in its own tmux / screen window (or as systemd-run --unit=... units) and redirect to dated log files.
# Pick a run directoryRUN=/var/log/perfrun-$(date +%Y%m%d-%H%M%S)mkdir -p "$RUN"# CPU + memory + I/O + run queue, every 5svmstat -t 5| tee "$RUN/vmstat.log"&# Per-CPU breakdownmpstat -P ALL 5| tee "$RUN/mpstat.log"&# Per-process CPU, mem and I/Opidstat -urd 5| tee "$RUN/pidstat.log"&# Disk extended statsiostat -xtz 5| tee "$RUN/iostat.log"&# Network interfacessar -n DEV 5| tee "$RUN/sar-net.log"&# Periodic process snapshotwhile true;do date '+=== %F %T ===' >> "$RUN/ps.log" ps -eo pid,ppid,stat,pcpu,pmem,rss,vsz,wchan:25,args --sort=-pcpu \
| head -50 >> "$RUN/ps.log" sleep 30done&
Tip
Each tool prints its own timestamp (-t, -tt, sar’s default), which is essential for correlating across files when reviewing later.
Option 3: Let sar quietly record everything
sar is the unsung hero of intermittent issues. The sysstat package ships a cron/systemd timer that writes a binary record of system activity every 10 minutes by default — you can tighten this to every minute.
# Enable and start the collectorsudo systemctl enable --now sysstat
# On most distros, tighten the sample interval:sudo sed -i 's|^\*/10 |*/1 |' /etc/cron.d/sysstat 2>/dev/null ||true# (On systems using the systemd timer, edit sysstat-collect.timer instead)
Then, after the event, mine the history:
# CPU history for a specific day (day-of-month)sar -u -f /var/log/sysstat/sa15
# Restrict to the window of interestsar -u -s 03:00:00 -e 04:00:00 -f /var/log/sysstat/sa15
# Memory, swap, I/O, network, run queue, context switchessar -r -f /var/log/sysstat/sa15
sar -S -f /var/log/sysstat/sa15
sar -b -f /var/log/sysstat/sa15
sar -n DEV -f /var/log/sysstat/sa15
sar -q -f /var/log/sysstat/sa15
sar -w -f /var/log/sysstat/sa15
Option 4: Triggered capture
For “I only need data when something is wrong” cases, gate the collection on a threshold. Example: dump rich diagnostics when load average crosses 10.
The same pattern works for memory thresholds, D-state process counts, specific log-line matches, or any other signal.
Analysing the logs afterwards
# When did we swap?awk 'NR>2 && ($7>0 || $8>0)' vmstat.log
# When did %iowait spike?awk 'NR>3 && $16>20' vmstat.log # column index depends on vmstat version# Which processes had the biggest RSS over time?awk '$6 > 500000' pidstat.log
# Which disks went past 20ms await?awk '$10 > 20' iostat.log
Always cross-reference timestamps
Correlate your collected logs with journalctl --since=... --until=... and dmesg -T. The kernel ring buffer often shows OOM kills, hung tasks, or block-device errors that explain what the metrics were reacting to.
Quick diagnostic workflow (cheatsheet)
# 1. What's using CPU right now?pidstat -u 160| tee /tmp/cpu.log
# 2. What's using memory?pidstat -r 130| tee /tmp/mem.log
awk '$6 > 100000' /tmp/mem.log # RSS > 100 MB# 3. Is the system swapping?vmstat 110# watch si / so# 4. Is disk I/O the bottleneck?iostat -xz 110# watch await, %util# 5. Find processes in bad statesps aux | awk '$8 ~ /^[DZ]/'# D-state or zombies# 6. What is a specific process waiting on?cat /proc/<PID>/wchan
grep State /proc/<PID>/status
# 7. How much memory is a process really using?grep -E 'VmRSS|VmSwap|VmSize' /proc/<PID>/status
cat /proc/<PID>/smaps_rollup
# 8. Is a process leaking memory? Watch RSS over time.watch -n2 'grep VmRSS /proc/<PID>/status'# 9. Was there an OOM kill / hung task / disk error?dmesg -T | grep -iE 'oom|killed process|hung task|i/o error|blocked for'journalctl -k --since "1 hour ago"| grep -iE 'oom|hung|error'
TL;DR
Decide first: is this Track A (live) or Track B (intermittent)? Don’t try to catch a rare event by staring at top.
For live triage, run the 60-second sweep: vmstat, mpstat, pidstat -urd, iostat -xz, free -h. Stop as soon as the bottleneck is obvious.
For intermittent issues, deploy LinuxAiOPerf — or arm sar plus a handful of tee’d collectors — before the next occurrence and mine the logs after.
Always correlate metrics with dmesg -T and journalctl. The kernel usually tells you what the numbers were reacting to.
1.4 - Understanding IO Delays in Linux - Performance Testing with io-delayer
A deep dive into Linux IO performance degradation using kernel modules to simulate VFS and block device delays, with engineering analysis of path resolution and queue congestion impacts.
Simulate and analyze IO performance degradation at multiple kernel layers to understand system bottlenecks.
Why IO Delays Matter in System Performance
Input/Output operations form the backbone of system performance, yet they represent one of the most complex and often misunderstood aspects of Linux performance engineering. When applications experience slowdowns, the root cause frequently traces back to IO delays introduced at various kernel layers.
The io-delayer kernel module provides a controlled environment to study these delays, helping engineers understand how different types of IO interception impact overall system performance.
The io-delayer Tool
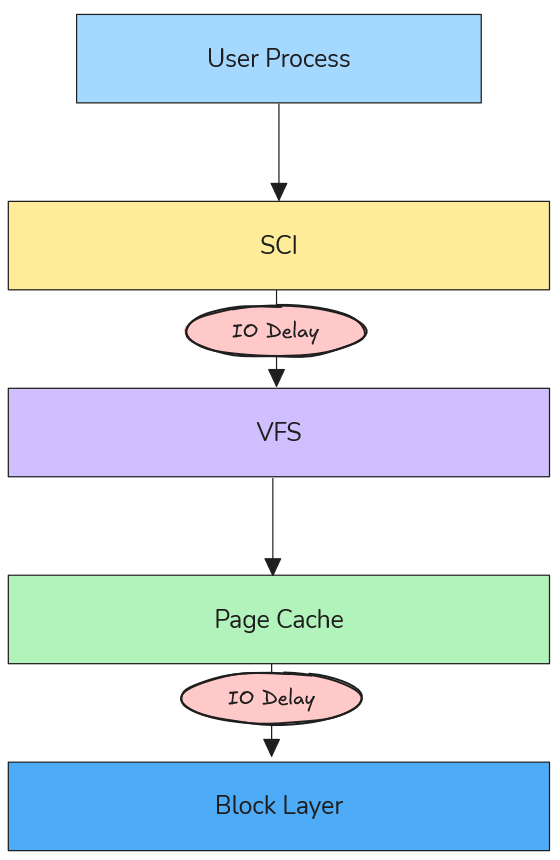
io-delayer is a Linux kernel module that demonstrates IO performance degradation by intercepting operations at two critical kernel layers:
Figure: Visualization of IO delays at different Linux kernel layers (VFS vs Block Device).
VFS (Virtual File System) Layer: Where path resolution and high-level file operations occur
Block Device Layer: Where actual storage device interactions happen
Using kprobes, the module inserts configurable microsecond delays into the IO path, allowing precise measurement of performance impact across different scenarios.
VFS Layer Delays: The Path Resolution Bottleneck
Understanding VFS in the IO Stack
The Virtual File System layer sits between system calls and actual filesystem implementations. When an application calls open(), read(), or write(), these requests pass through VFS before reaching storage devices.
According to the Linux kernel VFS documentation, VFS provides a unified interface that abstracts different filesystem types while handling core operations like:
Path name resolution (translating /home/user/file.txt to inode references)
Permission checking
File descriptor management
Caching coordination
How VFS Delays Degrade Performance
VFS delays primarily impact path resolution times, which become critical in scenarios involving:
1. Directory Traversal Operations
// Every path component requires VFS resolution
intfd=open("/home/user/documents/large-dataset/file-001.dat",O_RDONLY);
Each directory in the path (home, user, documents, large-dataset) triggers VFS operations. A 100μs delay per VFS call on a deep path like /var/lib/docker/containers/... can accumulate to milliseconds.
2. Metadata-Heavy Workloads
Applications that perform many stat() calls or directory listings suffer disproportionately:
Package managers during dependency resolution
File browsers indexing directories
Backup tools scanning filesystem trees
3. Process Startup Overhead
Binary execution involves resolving library paths through VFS:
# Dynamic linker resolves ~50-100 library paths per process startexecve("/usr/bin/python3", ...)
Real-World VFS Delay Scenarios
Antivirus Software Impact: Modern endpoint protection often hooks VFS operations to scan files during access. A 50-200μs delay per file operation can make boot times 2-3x slower.
Container Filesystem Overhead: Docker’s layered filesystem adds VFS traversal through multiple overlay layers. Additional delays here compound with existing virtualization overhead.
Network Filesystem Latency: NFS and CIFS clients already introduce network round-trips; VFS delays can make interactive applications feel unresponsive.
Throughput Degradation: Device saturation occurs at lower loads
2. IO Scheduler Inefficiency
Modern IO schedulers optimize for:
Seek Time Minimization: Grouping nearby requests
Fairness: Preventing starvation between processes
Priority Handling: Real-time vs. normal priority requests
Delays disrupt these optimizations, causing schedulers to make suboptimal decisions.
3. Cascading Effects
Block delays create feedback loops:
Delays increase queue depth
Deeper queues increase average wait time
Higher latency causes applications to issue more concurrent requests
More concurrency deepens queues further
Real-World Block Device Scenarios
Storage Security Appliances: Enterprise storage systems with inline deduplication, compression, or encryption add block-level delays. Understanding these helps size hardware appropriately.
Virtualization Storage Stacks: Hypervisor storage filters, vSAN layers, and distributed storage introduce block delays that compound with virtualization overhead.
Hardware RAID Controllers: Battery-backed write caches and consistency checks add measurable delays that affect application performance expectations.
Engineering Methodology: Testing with io-delayer
Installation and Setup
# Clone the repositorygit clone https://github.com/samatild/io-delayer.git
cd io-delayer
# Build and install (requires kernel headers)make all
sudo make install
sudo make load
Key Insight: Container startup times degrade linearly with VFS delays, explaining performance differences between bare metal and containerized deployments.
Kernel Implementation Details
Kprobe Integration
The module uses kprobes to intercept kernel functions without modification:
Important: This module is for testing purposes only. Production use can cause system instability or data loss.
Requires root privileges for installation
Can impact system responsiveness during high-delay testing
Not intended for security enforcement (unlike actual antivirus software)
MIT licensed for educational and research use
Advanced Use Cases
Custom Kernel Instrumentation
The module serves as a template for building custom IO tracing tools:
// Add custom probes for specific filesystems
staticstructkprobekp_ext4_writepages={.symbol_name="ext4_writepages",.pre_handler=custom_ext4_handler,};
Performance Regression Testing
# Automated testing script#!/bin/bashfor delay in 050100 200;do sudo ./io-delayer-cli set$delay sudo ./io-delayer-cli set-blk $delay# Run your favorite benchmark utility (fio, tuxtoaster, etc.)echo"Testing with ${delay}us delays..." fio --name=regression_test --rw=randrw --rwmixread=70 --bs=4k --size=1G --runtime=30 --output=results_${delay}us.json
# Or use tuxtoaster for comprehensive system testing# tuxtoaster --category disk --test "Random IOPS R/W"# Reset delays between tests sudo ./io-delayer-cli set0 sudo ./io-delayer-cli set-blk 0 sleep 5done
Conclusion
The io-delayer kernel module provides essential visibility into how IO delays at different kernel layers impact overall system performance. By understanding VFS path resolution bottlenecks and block device queue congestion, engineers can make informed decisions about:
Security software deployment strategies
Storage system architecture choices
Container performance optimization
Application performance expectations
The tool bridges the gap between theoretical kernel knowledge and practical performance engineering, enabling data-driven decisions in complex Linux environments.
Key Takeaways:
VFS delays primarily affect interactive performance through path resolution overhead
Block device delays create queue congestion that impacts throughput and scalability
Real-world delays range from microseconds (software) to milliseconds (hardware)
Systematic testing with tools like io-delayer prevents performance surprises
Parse, analyze, and understand Linux diagnostic reports with automated intelligence.
What is SOSParser?
SOSParser is a powerful web application designed to automatically parse and analyze Linux sosreport and supportconfig diagnostic files, converting them into comprehensive, interactive HTML reports. Created to streamline the often tedious process of manually reviewing system diagnostic data, SOSParser transforms raw diagnostic archives into structured, searchable insights that accelerate troubleshooting and system analysis.
Whether you’re a system administrator, DevOps engineer, or support technician dealing with complex Linux environments, SOSParser provides an automated approach to understanding what’s happening inside your systems.
The Problem SOSParser Solves
When Linux systems encounter issues, the standard diagnostic approach involves generating comprehensive reports using tools like:
sosreport - A utility that collects detailed system information from Red Hat-based distributions
# Pull the official imagedocker pull samuelmatildes/sosparser:latest
# Run the containerdocker run -d -p 8000:8000 --name sosparser samuelmatildes/sosparser:latest
Then open http://localhost:8000 in your browser.
Persisting Data
For production use, mount volumes to persist uploads and generated reports:
# Using bind mountsdocker run -d -p 8000:8000 --name sosparser \
-v $(pwd)/data/uploads:/app/webapp/uploads \
-v $(pwd)/data/outputs:/app/webapp/outputs \
samuelmatildes/sosparser:latest
# Using named volumesdocker run -d -p 8000:8000 --name sosparser \
-v sosparser_uploads:/app/webapp/uploads \
-v sosparser_outputs:/app/webapp/outputs \
samuelmatildes/sosparser:latest
Local Development
To build and run locally:
git clone https://github.com/samatild/SOSParser.git
cd SOSParser
docker build -t sosparser:local .
docker run -d -p 8000:8000 sosparser:local
Using SOSParser
Web Interface Workflow
Upload: Select your sosreport or supportconfig file (supports multiple formats)
Analyze: Click “Analyze Report” to start automated processing
Review: Browse the generated interactive HTML report
Data Privacy: Sensitive information remains within your infrastructure
Audit Trail: Processing logs available for compliance requirements
Integration and Automation
API Access
SOSParser provides REST API endpoints for integration with existing workflows:
# Upload and analyze via APIcurl -X POST -F "[email protected]" http://localhost:8000/api/analyze
CI/CD Integration
Automated analysis of system snapshots
Regression testing for configuration changes
Compliance validation pipelines
Monitoring Integration
Alert generation based on analysis results
Dashboard integration for system health overview
Trend analysis across multiple systems
Contributing and Community
SOSParser is an open-source project that welcomes contributions:
Bug Reports: Use GitHub Issues for problems or feature requests
Code Contributions: Pull requests are reviewed and merged regularly
Documentation: Help improve guides and examples
Testing: Report compatibility with different Linux distributions
Join the community on Telegram for updates, discussions, and support.
Troubleshooting SOSParser
Common Issues
Upload Failures
Check file size limits (typically 500MB max)
Verify archive integrity before upload
Ensure proper file permissions
Analysis Errors
Confirm the diagnostic file was generated correctly
Check for corrupted archives
Review Docker logs for processing errors
Performance Issues
Allocate sufficient CPU and memory resources
Process large reports during off-peak hours
Consider horizontal scaling for high-volume environments
Conclusion
SOSParser represents a significant advancement in Linux system diagnostics, transforming the traditionally manual and time-intensive process of analyzing sosreport and supportconfig files into an automated, intelligent workflow. By providing comprehensive analysis, actionable insights, and interactive reports, it empowers system administrators and support teams to resolve issues faster and maintain healthier Linux environments.
Whether you’re managing a single server or overseeing enterprise-scale deployments, SOSParser provides the tools needed to understand your systems at a deeper level, identify potential issues before they become critical, and maintain optimal system health.
Tux Toaster is an all-in-one performance toolkit for Linux. It triggers various load tests (“toasters”) to help you evaluate the performance and stability of your system across CPU, memory, disk, and network. It offers an interactive terminal menu with multi-select support and clear, stoppable workloads.
Network: continuous download of https://proof.ovh.net/files/100Mb.dat
Disk: alternating dd read/write with 4MB direct I/O under a temp file
Reading results
Tux Toaster prints live progress and a summary when you stop a test. Disk tests create temporary files under a dedicated directory on the selected mount points and clean up on exit. Network tests report bandwidth per socket in multi-socket modes.
Tips:
Run tests at least 3 times and use medians for comparisons.
Keep a record of CPU governor, kernel version, microcode, and thermal state.
Pin CPU frequency when comparing hardware to reduce variance.
Prepare a system to collect crash dumps before a kernel panic occurs
Understand why a machine hung, soft-locked, or hard-locked
Learn how privilege levels and system calls shape performance and security behavior
Investigate CPU statistics and kernel symptoms with better context
2.1 - Soft and Hard Lockups
Detect, troubleshoot, and simulate Linux kernel soft and hard lockups with the watchdog.
Introduction
Kernel Watchdog
According to Linux Kernel Documentation, the Linux kernel can act as a watchdog to detect both soft and hard lockups.
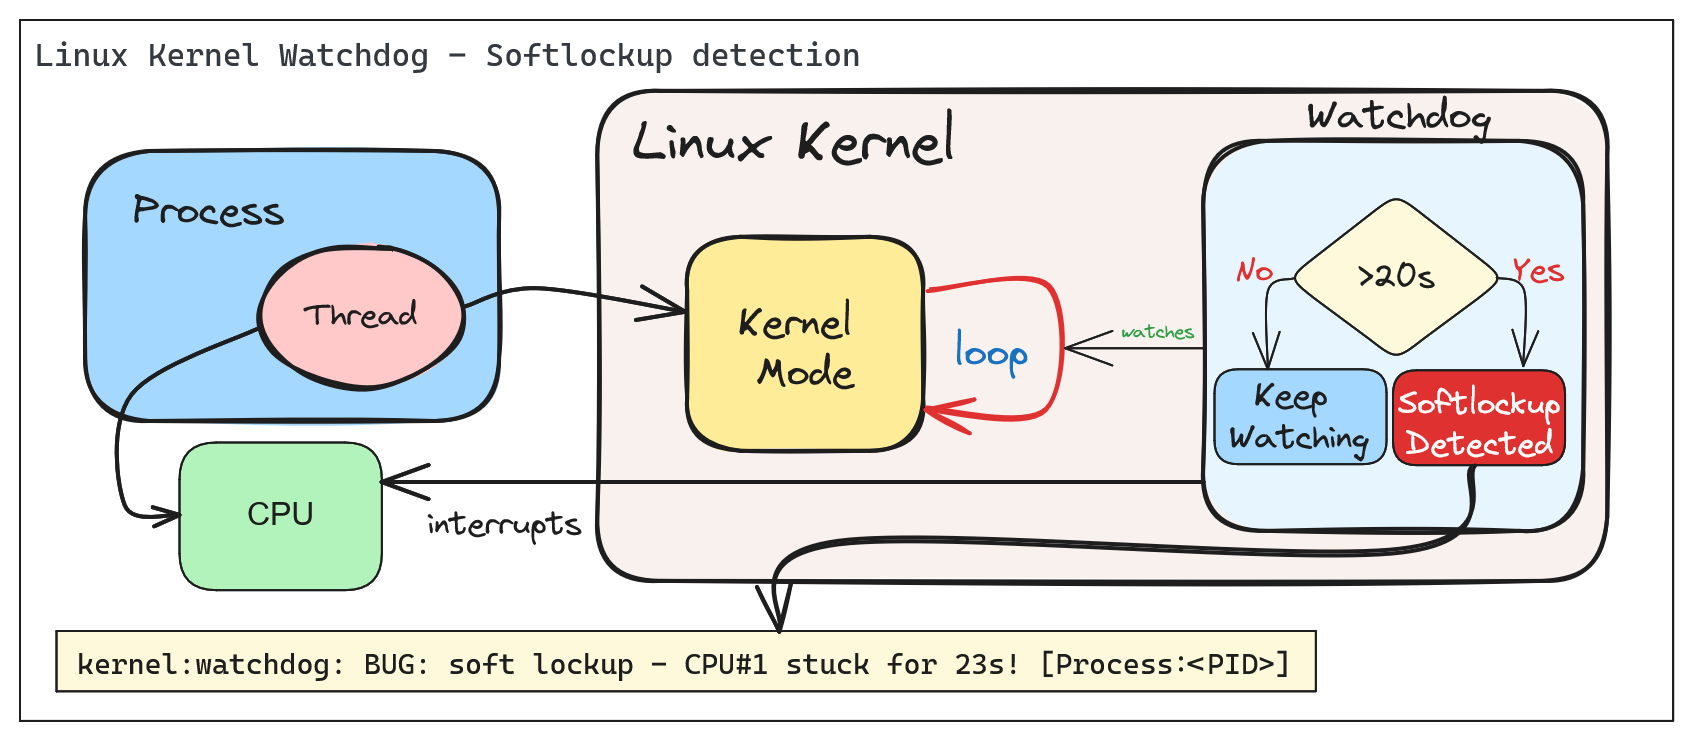
The Linux Kernel Watchdog is a mechanism that monitors the system for both soft and hard lockups. It is designed to detect when a CPU is stuck in a loop and unable to make progress. When a soft lockup is detected, the watchdog will print a warning message to the system log.
Soft vs. Hard Lockups
Soft Lockup
A ‘softlockup’ is defined as a bug that causes the kernel to loop in kernel mode for more than 20 seconds, without giving other tasks a chance to run. The current stack trace is displayed upon detection and, by default, the system will stay locked up.
By default the system will display the stack trace and stay locked up. Watchdog can be configured to reboot the system automatically when a soft lockup is detected. This can be done by setting the softlockup_panic parameter to a value greater than zero.
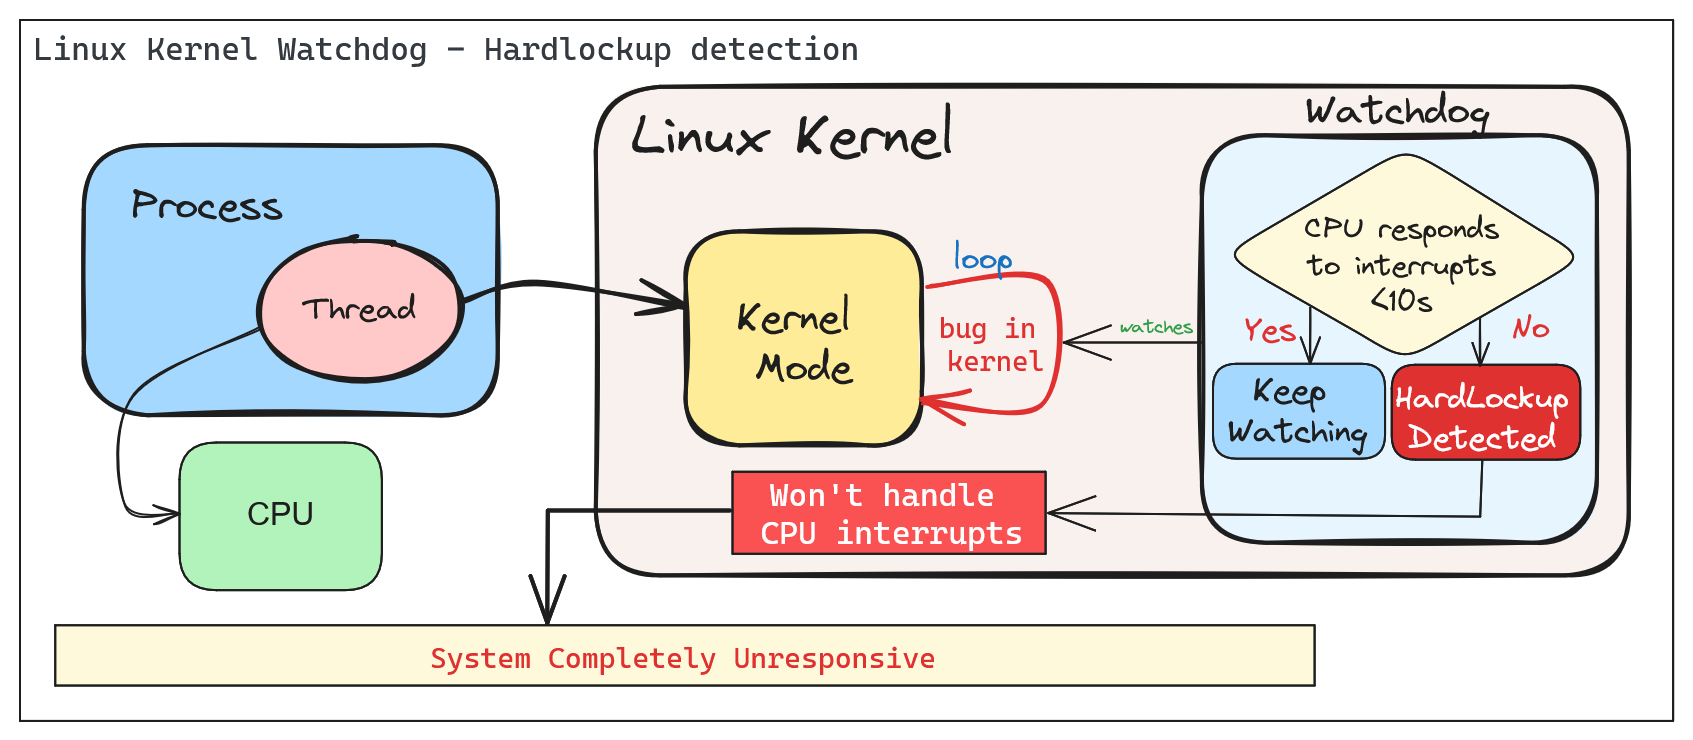
A ‘hardlockup’ is defined as a bug that causes the CPU to loop in kernel mode for more than 10 seconds, without letting other interrupts have a chance to run.
Similar to softlockup, the system will display the stack trace and stay locked up. The watchdog can be configured to reboot the system automatically when a hard lockup is detected. This can be done by setting the hardlockup_panic parameter to a value greater than zero.
Common error messages:
BUG: hard lockup - CPU#0 stuck for 22s! [swapper/0:1]Modules linked in: ...
Deep Dive into Soft/Hard Lockups
Reacting to soft/hard lockups
Ok, so you have a soft or hard lockup, what now? Here are some steps you can take to troubleshoot and resolve the issue:
The Basics
1. Check the system logs: Look for any error messages or warnings that may indicate the cause of the lockup.
2. Check the CPU load: High CPU load can cause lockups. Use tools like top or htop to monitor CPU usage.
3. Read the watchdog warning message: The watchdog will print a warning message to the system log when a lockup is detected. This message may provide clues as to the cause of the lockup. Usually, the message will include a stack trace that shows where the CPU is stuck, also the name of the process that caused the lockup and it’s PID.
Thresholds
The watchdog has default thresholds for detecting soft and hard lockups. These thresholds can be adjusted to suit your system’s needs.
Before changing thresholds, it is important to understand the implications of changing these values. Setting the thresholds too low may result in false positives, while setting them too high may result in missed lockups.
A periodic hrtimer runs to generate interrupts and kick the watchdog job. An NMI perf event is generated every “watchdog_thresh” (compile-time initialized to 10 and configurable through sysctl of the same name) seconds to check for hardlockups. If any CPU in the system does not receive any hrtimer interrupt during that time the ‘hardlockup detector’ (the handler for the NMI perf event) will generate a kernel warning or call panic, depending on the configuration.
The watchdog job runs in a stop scheduling thread that updates a timestamp every time it is scheduled. If that timestamp is not updated for 2*watchdog_thresh seconds (the softlockup threshold) the ‘softlockup detector’ (coded inside the hrtimer callback function) will dump useful debug information to the system log, after which it will call panic if it was instructed to do so or resume execution of other kernel code.
Check current threshold:
cat /proc/sys/kernel/watchdog_thresh
10
Update threshold to 30 seconds:
# For temporary changeecho30 > /proc/sys/kernel/watchdog_thresh
# For permanent changeecho"kernel.watchdog_thresh = 30" >> /etc/sysctl.conf
sysctl -p
Advanced Troubleshooting
The watchdog can be configured to panic the system when a lockup is detected. This can be done by setting the softlockup_panic or hardlockup_panic parameters to a value greater than zero.:
# Enable panic on soft lockupecho1 > /proc/sys/kernel/softlockup_panic
# Enable panic on hard lockupecho1 > /proc/sys/kernel/hardlockup_panic
In combination with crash dump, you can get a full dump of the system state when a lockup is detected. This can be useful for debugging the issue.
Step-by-step guide for this recipe:
1. Enable crash dump in the kernel configuration. Make sure that it’s collecting memory dumps when a kernel panic occurs.
2. Configure the kernel to reboot the system when a lockup is detected.
3. Proceed by analyzing the crash dump to identify the cause of the lockup.
Demo - Creating a Softlockup and understanding the watchdog output
Simulating a Soft Lockup
For the example below, we will simulate a soft lockup by loading a kernel module design to test if watchdog and lockup detection are working as expected.
Note: When installing Linux Kernel modules, make sure: You are using the correct version of the kernel module for your kernel version. (Browse kernel config source code and match your kernel version: Example for v6.9.5). And, that you have the necessary kernel headers installed.
The following parameters are available to simulate a variety of lockups:
# modinfo soft.kofilename: /root/CONFIG_TEST_LOCKUP/soft.ko
description: Test module to generate lockups
author: Konstantin Khlebnikov <[email protected]>
license: GPL
srcversion: 302B4AE69F898F7B25CABF8
depends:
retpoline: Y
name: soft
vermagic: 5.15.0-1064-azure SMP mod_unload modversions
parm: time_secs:lockup time in seconds, default 0(uint)parm: time_nsecs:nanoseconds part of lockup time, default 0(uint)parm: cooldown_secs:cooldown time between iterations in seconds, default 0(uint)parm: cooldown_nsecs:nanoseconds part of cooldown, default 0(uint)parm: iterations:lockup iterations, default 1(uint)parm: all_cpus:trigger lockup at all cpus at once (bool)parm: state:wait in 'R' running (default), 'D' uninterruptible, 'K' killable, 'S' interruptible state (charp)parm: use_hrtimer:use high-resolution timer for sleeping (bool)parm: iowait:account sleep time as iowait (bool)parm: lock_read:lock read-write locks forread(bool)parm: lock_single:acquire locks only at one cpu (bool)parm: reacquire_locks:release and reacquire locks/irq/preempt between iterations (bool)parm: touch_softlockup:touch soft-lockup watchdog between iterations (bool)parm: touch_hardlockup:touch hard-lockup watchdog between iterations (bool)parm: call_cond_resched:call cond_resched() between iterations (bool)parm: measure_lock_wait:measure lock waittime(bool)parm: lock_wait_threshold:print lock waittime longer than this in nanoseconds, default off (ulong)parm: disable_irq:disable interrupts: generate hard-lockups (bool)parm: disable_softirq:disable bottom-half irq handlers (bool)parm: disable_preempt:disable preemption: generate soft-lockups (bool)parm: lock_rcu:grab rcu_read_lock: generate rcu stalls (bool)parm: lock_mmap_sem:lock mm->mmap_lock: block procfs interfaces (bool)parm: lock_rwsem_ptr:lock rw_semaphore at address (ulong)parm: lock_mutex_ptr:lock mutex at address (ulong)parm: lock_spinlock_ptr:lock spinlock at address (ulong)parm: lock_rwlock_ptr:lock rwlock at address (ulong)parm: alloc_pages_nr:allocate and free pages under locks (uint)parm: alloc_pages_order:page order to allocate (uint)parm: alloc_pages_gfp:allocate pages with this gfp_mask, default GFP_KERNEL (uint)parm: alloc_pages_atomic:allocate pages with GFP_ATOMIC (bool)parm: reallocate_pages:free and allocate pages between iterations (bool)parm: file_path:file path to test(string)parm: lock_inode:lock file -> inode -> i_rwsem (bool)parm: lock_mapping:lock file -> mapping -> i_mmap_rwsem (bool)parm: lock_sb_umount:lock file -> sb -> s_umount (bool)
We will simulate a soft lockup by loading the module with the following parameters:
After loading the module, the system will be locked up for 35 seconds. The watchdog will detect the soft lockup and print a warning message to the system log.
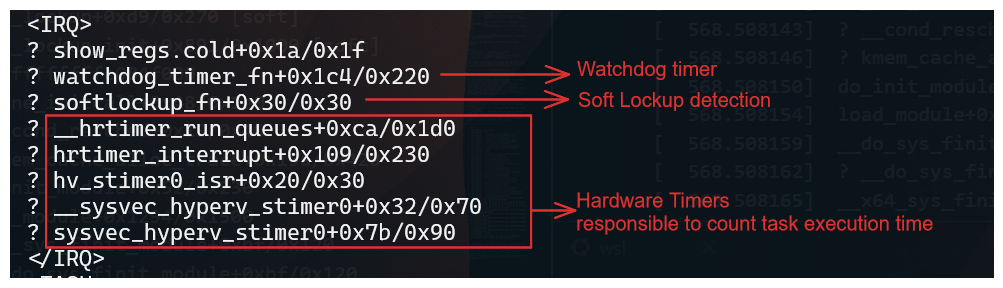
The stack trace shows where the CPU was stuck and provides information about the process that caused the lockup.
Important information from the stack trace:
IRQ - Indicates that the CPU was in an interrupt context when the lockup occurred.
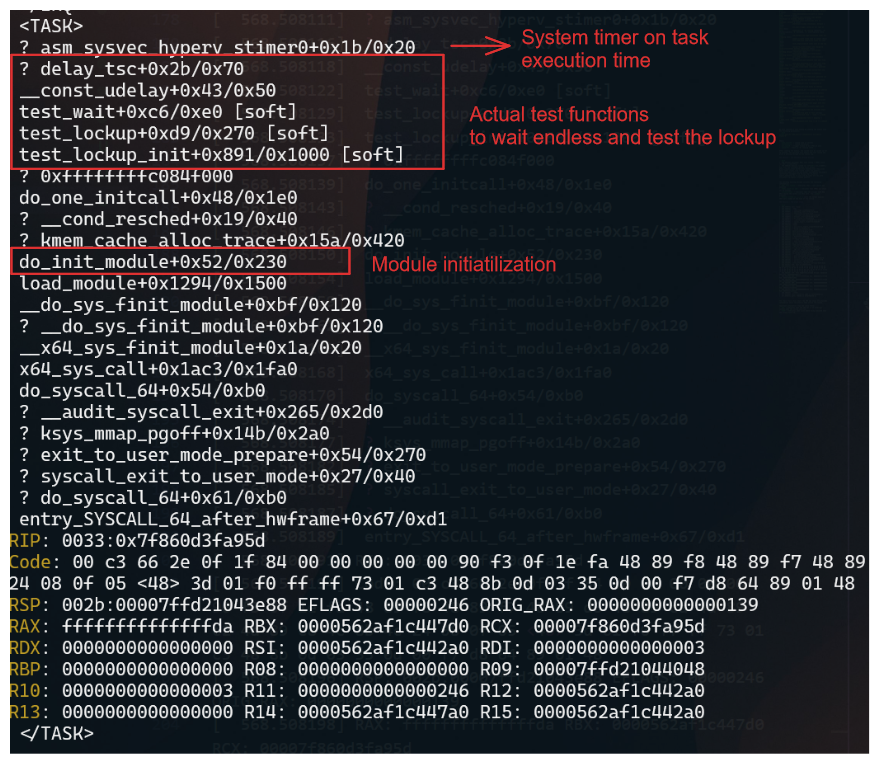
TASK - Indicates what calls where being executed when the lockup occurred.
When comparing with source code, you can identify the function that caused the lockup. In this case, the test_wait function in the soft module caused the lockup.
The test_wait function was waiting in the TASK_RUNNING state, which caused the CPU to be stuck in a loop.
Since we are loading a module, the execution will be in kernel mode, and the watchdog will detect the lockup.
The mdelay function was used to delay the execution of the function for a specified number of milliseconds. In this case, the function was delayed for 35 seconds, which caused the lockup.
Final Thoughts
The Linux Kernel Watchdog is a powerful tool for detecting soft and hard lockups. By understanding how the watchdog works and how to react to lockups, you can troubleshoot and resolve issues more effectively. Remember to check the system logs, CPU load, and watchdog warning messages when a lockup occurs. By following best practices and using advanced troubleshooting techniques, you can identify the root cause of lockups and take steps to prevent them in the future.
2.2 - Why Kernel Crash Dumps Are Critical for Root Cause Analysis
Deep-dive on using vmcore crash dumps for postmortem kernel debugging, including real-world kernel bug and OOM workflows.
Postmortem Kernel Forensics with vmcore
Summary
When the Linux kernel panics, there is no userspace stack, no application logs, and often no intact filesystems. The only canonical, lossless record of the kernel’s terminal state is the crash dump (vmcore). Without vmcore, you are constrained to heuristics and guesswork; with vmcore, you can deterministically reconstruct CPU state, task scheduling, memory allocators, locks, timers, and subsystems at the exact point of failure. This is the difference between timeline narratives and hard proof.
What a vmcore Captures (and Why It Matters)
CPU architectural state: general-purpose registers, control registers, MSRs, per-CPU contexts.
Full kernel virtual memory snapshot: page tables, slab caches, VFS dentries/inodes, networking stacks, block layer queues, and device driver state.
Task list and scheduler state: task_struct, runqueues, RT/DL classes, stop machine contexts.
Lock state: mutex, spinlock_t owners, wait queues, and contention points.
With unstripped vmlinux and kernel debuginfo, these structures become symbol-resolved and type-aware in tools like crash and gdb.
Minimal Prerequisites for a Useful Dump
Reserve crash kernel memory at boot: crashkernel=auto (or a fixed size appropriate to RAM and distro guidance).
Ensure kdump service is active and the dump target has write bandwidth and space (prefer raw disk/LVM or fast local FS; only use NFS/SSH if necessary).
Keep exact-matching debuginfo for the running kernel build:
Uncompressed vmlinux with full DWARF and symbols.
Matching System.map and all loaded module debuginfo (e.g., kernel-debuginfo, kernel-debuginfo-common on RHEL/Fedora; linux-image-…-dbgsym on Debian/Ubuntu repositories).
Persist critical panic policies:
sysctl -w kernel.panic_on_oops=1sysctl -w kernel.unknown_nmi_panic=1sysctl -w kernel.panic_on_unrecovered_nmi=1sysctl -w vm.panic_on_oom=2# 1=panic on OOM, 2=panic if no killable tasksysctl -w kernel.panic=10# auto-reboot N seconds after panic
Persist via /etc/sysctl.d/*.conf as needed. For manual testing, enable SysRq and force a controlled crash:
echo1| sudo tee /proc/sys/kernel/sysrq
echo c | sudo tee /proc/sysrq-trigger
Acquisition Pipeline and Size Reduction
makedumpfile can filter non-essential pages to reduce vmcore size and I/O time without destroying forensics value. Recommended options:
sys # kernel, uptime, panic infops # task list summarybt # backtrace of current task (set with 'set' or '-p PID')log # kernel ring buffer extracted from vmcorekmem -i # memory info: zones, nodes, reclaimersfiles -p <PID> # per-process file descriptorsdev -d # device list & driversirq # IRQ and softirq stateforeach bt # backtrace all tasks (can be heavy on large systems)
Example 1 — Kernel Bug/Oops Leading to Panic
Symptoms at runtime: abrupt reboot, serial console shows BUG/oops with taint flags; no userspace core dumps.
Postmortem workflow:
vmcore-dmesg /var/crash/vmcore | less
Look for signatures such as:
BUG: unable to handle kernel NULL pointer dereference at 0000000000000010
RIP: 0010:driver_xyz_process+0x5a/0x120 [driver_xyz]
Call Trace:
  worker_thread+0x8f/0x1a0
  kthread+0xef/0x120
  ret_from_fork+0x2c/0x40
Tainted: G    B  W  OE  5.14.0-xyz #1
Correlate symbols and inspect the faulting frame:
crash> sym driver_xyz_process
crash> dis -l driver_xyz_process+0x5a
crash> bt
crash> set -p <pid_of_worker>
crash> bt -f # show full frames with argumentscrash> struct task_struct <task_addr>
crash> ps
   PID    PPID  CPU       TASK        ST  %MEM     VSZ    RSS  COMM
> 4123       2    7  ffff8b2a7f1f0c00  RU   0.1   0      0    kworker/u16:2
   1         0    0  ffff8b2a70000180  IN   0.0  16272  1308  systemd
   532       1    2  ffff8b2a703f9b40  IN   0.2  912312 80324 containerd
   987     532    5  ffff8b2a7a2fcd00  IN   0.4  1452312 231212 kubelet
crash> bt
PID: 4123  TASK: ffff8b2a7f1f0c00  CPU: 7  COMMAND: "kworker/u16:2"
 #0 [ffffb2f1c2d2be78] machine_kexec at ffffffff914b3e10
 #1 [ffffb2f1c2d2bec8] __crash_kexec at ffffffff915a1c32
 #2 [ffffb2f1c2d2bf28] panic at ffffffff914c2a9d
 #3 [ffffb2f1c2d2bf80] oops_end at ffffffff9148df90
 #4 [ffffb2f1c2d2bfb0] page_fault_oops at ffffffff9148e4b5
 #5 [ffffb2f1c2d2bfe0] exc_page_fault at ffffffff91abc7e1
 #6 [ffffb2f1c2d2c018] asm_exc_page_fault at ffffffff91c0133e
 #7 [ffffb2f1c2d2c048] driver_xyz_process+0x5a/0x120 [driver_xyz]
 #8 [ffffb2f1c2d2c0a0] worker_thread+0x8f/0x1a0
 #9 [ffffb2f1c2d2c0e0] kthread+0xef/0x120
#10 [ffffb2f1c2d2c110] ret_from_fork+0x2c/0x40
crash> kmem -i
                 PAGES        TOTAL      PERCENTAGE
    TOTAL MEM    3276800      12.5 GB   100%
         FREE     152345       595 MB     4%
         USED    3124455      11.9 GB    96%
       SHARED      80312       313 MB     2%
      BUFFERS      49152       192 MB     1%
       CACHED     842304       3.2 GB    26%
        SLAB      921600       3.5 GB    28%
      PAGECACHE   655360       2.5 GB    20%
ZONE DMA32: min 16224, low 20280, high 24336, scanned 1e6, order 3 allocs failing
Reclaimers: kswapd0: active, direct reclaim: observed
crash> log | head -n 6
<0>[ 1234.567890] Kernel panic - not syncing: Fatal exception
<4>[ 1234.567900] CPU: 7 PID: 4123 Comm: kworker/u16:2 Tainted: G    B  W  OE
<4>[ 1234.567905] RIP: 0010:driver_xyz_process+0x5a/0x120 [driver_xyz]
<6>[ 1234.567950] Workqueue: events_unbound driver_xyz_wq
Actionable patterns:
Null-dereference at a deref site → check expected invariants and lifetime rules for the object; validate RCU usage (rcu_read_lock()/_unlock() pairs) and reference counting (kref, refcount_t).
Use-after-free → examine slab allocator metadata around the pointer; kmem and rd -p (raw reads) can validate freelist poisoning.
Interrupt vs thread context → verify hardirq/softirq context in bt; ensure lock acquisition order obeys documented lockdep dependencies.
If tainted by proprietary modules (OE), ensure matching module debuginfo is loaded so frames resolve cleanly. Validate module list:
crash> mod
From here, produce a minimal repro and map the faulting path to specific source lines using dis -l and DWARF line tables; attach exact register state and call trace to the fix.
Example 2 — Out-Of-Memory (OOM) and Panic-on-OOM
By default, OOM does not produce a vmcore because the kernel kills a task to free memory and continues. For deterministic forensics on pathological memory pressure, set vm.panic_on_oom=1 or 2 so the system panics and kdump captures a vmcore.
crash> kmem -i # zones, watermarks, reclaimers statecrash> kmem -s # slab usage; look for runaway cachescrash> ps -m # memory stats per taskcrash> vtop <task> <va> # translate VA to PFN to inspect mappingcrash> files -p <PID> # fd pressure and mmapscrash> p sysctl_oom_dump_tasks
crash> log # OOM killer selection rationale, constraints
Indicators:
oom-kill:constraint=CONSTRAINT_NONE,nodemask=(null),cpuset=... shows the policy path; score/oom_score_adj determine the victim.
Stalled reclaim (kswapd, direct reclaim) with high order allocations failing → likely hugepages, GFP_ATOMIC depletion, or CMA stress.
One slab consuming disproportionate memory → e.g., runaway dentry or kmalloc-64 due to leak; confirm with kmem -S and inspect suspects via object walkers if available.
If OOM was triggered by a specific container/cgroup, use cgroup-aware views (kernel dependent):
crash> p memory.stat @<memcg_addr>
Correlating vmcore with Source and Binaries
Always analyze with the exact build artifacts of the panicked kernel:
vmlinux and module .debug files must match the uname -r and build ID of the running kernel at the time of panic.
Mismatches lead to wrong type layouts, invalid offsets, and misleading backtraces.
On distros with split debuginfo, install the debuginfo packages for the precise NVR (Name-Version-Release) string.
2.3 - Enabling Automatic Kernel Crash Collection with kdump
How to automatically enable and configure kdump crash collection on Linux systems using the kdump-enabler script.
Automatic Enablement of Kernel Crash Dump Collection with kdump-enabler
This article explains how to automatically enable and configure kernel crash dump (kdump) collection on Linux systems using the kdump-enabler script. This approach works across multiple distributions and simplifies the process of preparing your system to collect crash dumps for troubleshooting and analysis.
Overview
kdump-enabler is a Bash script that automates the setup of kdump:
Installs required packages
Configures the crashkernel parameter in GRUB
Enables and starts the kdump service
Sets up SysRq for manual crash triggering
Creates backups of configuration files before changes
Supports Ubuntu, Debian, RHEL, CentOS, Fedora, openSUSE, Arch Linux, and more
Prerequisites
Root privileges (run with sudo)
systemd-based Linux distribution
GRUB bootloader
Sufficient disk space in /var/crash for crash dumps
Installation
Clone the repository and run the script:
git clone https://github.com/samatild/kdump-enabler.git
cd kdump-enabler
sudo ./kdump-enabler.sh
sudo ./kdump-enabler.sh --check-only
# Output (abridged):[INFO] Checking current kdump configuration...
[WARNING] No crashkernel parameter found in kernel command line
[WARNING] kdump service not found
[INFO] Crash dump directory: /var/crash (0 dumps found)# Exits after status check without installing or modifying anything
Skip SysRq enablement
sudo ./kdump-enabler.sh -y --no-sysrq
# Output differences:# - Does not enable SysRq or persist sysctl settings# - All other steps (packages, GRUB, service) proceed
2.4 - Kernel Mode vs User Mode: Privilege Levels and System Call Execution
Deep technical explanation of CPU privilege levels, kernel mode vs user mode execution contexts, system call mechanisms, memory protection, and security implications in the Linux kernel.
CPU Privilege Levels and Execution Contexts
Summary
Modern processors implement hardware-enforced privilege levels to isolate untrusted user code from critical kernel services. Linux uses two primary modes: kernel mode (ring 0, CPL 0, EL1) and user mode (ring 3, CPL 3, EL0). Kernel mode grants unrestricted access to CPU features, physical memory, I/O ports, and privileged instructions. User mode restricts access to a virtualized, isolated address space and requires kernel mediation for hardware resources. The transition between modes occurs via system calls, interrupts, and exceptions, all managed by the kernel’s interrupt and system call handlers. Understanding this separation is fundamental to security, performance optimization, and kernel debugging.
CPU Privilege Levels (Architecture Overview)
x86/x86-64 Privilege Rings
The x86 architecture defines four privilege levels (rings 0-3), though Linux uses only rings 0 and 3:
Access to kernel address space (typically 0xffff800000000000 and above on x86-64)
Can modify page tables, MMU configuration
2. Privileged Instructions
cli/sti (disable/enable interrupts)
lgdt/lidt (load GDT/IDT)
mov crX (control register access)
in/out (I/O port access)
hlt (halt CPU)
wrmsr/rdmsr (Model-Specific Registers)
3. Interrupt and Exception Handling
Can install interrupt handlers
Access to interrupt controller (APIC, GIC)
Exception vector table modification
4. System Control
CPU scheduling decisions
Process creation/destruction
File system operations
Network stack management
Kernel example - Direct memory access:
// Kernel can directly access physical memory
void*phys_addr=__va(0x1000000);// Convert physical to virtual
unsignedlongvalue=*(unsignedlong*)phys_addr;// User mode cannot do this - would cause segmentation fault
Kernel Mode Execution Contexts
1. Process Context
Executing on behalf of a user process (system call handler)
Has associated task_struct, user-space memory mappings
Can sleep, be preempted
Example: read(), write(), open() syscall handlers
2. Interrupt Context
Executing in response to hardware interrupt
No associated process (current may point to interrupted process)
// arch/x86/kernel/entry_64.S
ENTRY(entry_SYSCALL_64)// Save user context
SWAPGSmovq%rsp,PER_CPU_VAR(cpu_current_top_of_stack)// Switch to kernel stack
movqPER_CPU_VAR(cpu_current_top_of_stack),%rsp// Now in kernel mode, process context
calldo_syscall_64
User Mode Characteristics
Restrictions and Isolation
1. Virtual Memory Only
Cannot access physical addresses directly
Limited to virtual address space (typically 0x0000000000000000 to 0x00007fffffffffff on x86-64)
Page tables managed by kernel, not user-space
Segmentation fault on invalid access
2. No Privileged Instructions
Attempting privileged instructions causes General Protection Fault (#GP)
Trapped by kernel, typically results in SIGSEGV to process
3. System Call Interface
Must use system calls to request kernel services
System calls are the controlled entry point to kernel mode
Each syscall has defined parameters and return values
4. Process Isolation
Each process has independent virtual address space
Cannot directly access other processes’ memory
Inter-process communication requires kernel mediation (shared memory, pipes, sockets)
User-space example - Attempting privileged operation:
// This will fail in user mode
intmain(){unsignedlongcr0;asmvolatile("mov %%cr0, %0":"=r"(cr0));// Privileged instruction
// Result: SIGSEGV - Segmentation fault
return0;}
User-space example - Valid system call:
// User mode must use system calls
intmain(){intfd=open("/etc/passwd",O_RDONLY);// System call
if(fd<0){perror("open");return1;}close(fd);// System call
return0;}
Mode Transitions: System Calls
System Call Mechanism
System calls are the controlled mechanism for transitioning from user mode to kernel mode. The transition involves:
User-space preparation: Set up syscall number and arguments
Hardware trap: CPU switches to kernel mode via special instruction
Kernel handler: Kernel validates and executes requested operation
Return: Kernel switches back to user mode with result
x86-64 System Call Interface
Transition from User Mode to Kernel Mode via System Call (Click to expand)
Syscall instruction (syscall):
Fastest method on x86-64
System call number in %rax
Arguments in %rdi, %rsi, %rdx, %r10, %r8, %r9
Return value in %rax
Return address in %rcx
Kernel source:arch/x86/entry/entry_64.S
// User-space syscall invocation (glibc wrapper)
staticinlinelong__syscall0(longn){longret;asmvolatile("syscall":"=a"(ret):"a"(n):"rcx","r11","memory");returnret;}// Kernel entry point
ENTRY(entry_SYSCALL_64)UNWIND_HINT_EMPTY// Swap GS to kernel space
swapgs// Save user-space registers
movq%rsp,PER_CPU_VAR(cpu_current_top_of_stack)// Load kernel stack
movqPER_CPU_VAR(cpu_current_top_of_stack),%rsp// Call C handler
calldo_syscall_64
// Simplified syscall handler
__visiblenoinstrvoiddo_syscall_64(structpt_regs*regs,intnr){// Validate syscall number
if(likely(nr<NR_syscalls)){// Get syscall function pointer
syscall_fn_tsyscall_fn=syscall_table[nr];// Execute syscall (still in kernel mode)
regs->ax=syscall_fn(regs);}else{regs->ax=-ENOSYS;}// Return to user mode
syscall_exit_to_user_mode(regs);}
Practical example - Tracing system calls:
# Trace all syscalls made by a processstrace -e trace=all ls -l
# Example output:# openat(AT_FDCWD, "/etc/ld.so.cache", O_RDONLY|O_CLOEXEC) = 3# read(3, "\177ELF\2\1\1\3\0\0\0\0\0\0\0\0\3\0>\0\1\0\0\0\360\3\2\0\0\0\0\0"..., 832) = 832# close(3) = 0# openat(AT_FDCWD, ".", O_RDONLY|O_NONBLOCK|O_CLOEXEC|O_DIRECTORY) = 3# getdents64(3, /* 5 entries */, 32768) = 144# close(3) = 0
CPU saves user context (registers, return address)
Kernel interrupt handler executes
Kernel returns to user mode (or schedules different task)
Kernel source:arch/x86/entry/entry_64.S
// Interrupt entry point
ENTRY(common_interrupt)// Save all registers
SAVE_ALL// Disable interrupts (if needed)
cli// Call C interrupt handler
calldo_IRQ// Restore and return
RESTORE_ALLiretq
Exception Types
Faults (correctable):
Page fault (#PF): Virtual memory access violation
General Protection Fault (#GP): Invalid memory access, privilege violation
# Install perf toolssudo apt-get install linux-perf
# Trace syscalls with timingsudo perf trace -e syscalls:sys_enter_openat,syscalls:sys_exit_openat ls
# Output shows:# 0.000 openat(AT_FDCWD, "/etc/ld.so.cache", O_RDONLY|O_CLOEXEC) = 3# 0.012 <... openat resumed> ) = 3# Each line shows user->kernel->user transition
Example 2: Kernel vs User Memory Access
User-space program:
#include<stdio.h>#include<unistd.h>#include<sys/mman.h>intmain(){// User-space memory allocation
void*user_addr=mmap(NULL,4096,PROT_READ|PROT_WRITE,MAP_PRIVATE|MAP_ANONYMOUS,-1,0);printf("User-space address: %p\n",user_addr);*(int*)user_addr=42;// OK - user can write to own memory
// Attempt kernel-space access
void*kernel_addr=(void*)0xffffffff80000000;// *(int *)kernel_addr = 42; // Would cause SIGSEGV
return0;}
Kernel module (for comparison):
// Kernel module can access both
staticint__inittest_init(void){void*user_addr=(void*)0x400000;// User-space address
void*kernel_addr=(void*)0xffffffff80000000;// Kernel address
// Access kernel memory (requires proper mapping)
// unsigned long val = *(unsigned long *)kernel_addr;
// Access user memory (requires copy_from_user)
// unsigned long val;
// copy_from_user(&val, user_addr, sizeof(val));
return0;}
Example 3: System Call Overhead
Measure syscall overhead:
#include<stdio.h>#include<sys/time.h>#include<unistd.h>intmain(){structtimevalstart,end;longiterations=1000000;gettimeofday(&start,NULL);for(longi=0;i<iterations;i++){getpid();// System call
}gettimeofday(&end,NULL);longus=(end.tv_sec-start.tv_sec)*1000000+(end.tv_usec-start.tv_usec);printf("Average syscall time: %.2f nanoseconds\n",(us*1000.0)/iterations);return0;}// Typical output: ~200-500 nanoseconds per syscall
// This includes: user->kernel transition + handler + kernel->user return
Example 4: Inspecting Current Mode
Check if code is running in kernel or user mode:
# From user-space (always shows user mode)cat /proc/self/status | grep State
# From kernel module (can check current mode)# In kernel code:if(user_mode(regs)){ printk("Running in user mode\n");}else{ printk("Running in kernel mode\n");}
Kernel Internals: Mode Switching Code
Context Switch and Mode Return
Returning to user mode after syscall:
// arch/x86/entry/common.c
__visiblenoinstrvoidsyscall_exit_to_user_mode(structpt_regs*regs){// Check for pending work (signals, preemption)
exit_to_user_mode_prepare(regs);// Restore user-space registers
__syscall_exit_to_user_mode_work(regs);}static__always_inlinevoid__syscall_exit_to_user_mode_work(structpt_regs*regs){// Restore GS (swap back to user GS)
swapgs;// Return to user mode
// IRET instruction restores:
// - CS (code segment) -> CPL=3
// - SS (stack segment)
// - RFLAGS (flags register)
// - RIP (instruction pointer)
// - RSP (stack pointer)
}
Interrupt Return
Returning from interrupt handler:
// arch/x86/entry/entry_64.S
ENTRY(common_interrupt_return)// Check if returning to user mode
testb$3,CS(%rsp)jnzswapgs_restore_regs_and_return_to_usermode// Returning to kernel mode
RESTORE_ALLiretqswapgs_restore_regs_and_return_to_usermode:// Swap GS back to user mode
swapgsRESTORE_ALLiretq
Performance Considerations
System Call Overhead
Factors affecting syscall performance:
Mode transition cost: ~50-100 CPU cycles
Register save/restore: ~100-200 cycles
Cache effects: TLB flushes, cache misses
Handler execution: Varies by syscall (nanoseconds to microseconds)
Optimization techniques:
vDSO (Virtual Dynamic Shared Object): Some syscalls (e.g., gettimeofday()) execute in user-space
Avoid unnecessary syscalls: Cache results, use memory-mapped I/O
Reducing Mode Transitions
Example - Reducing gettimeofday() overhead:
// Traditional approach (syscall each time)
for(inti=0;i<1000;i++){gettimeofday(&tv,NULL);// 1000 syscalls
}// Optimized approach (vDSO - no syscall)
#include<sys/time.h>#include<time.h>for(inti=0;i<1000;i++){clock_gettime(CLOCK_REALTIME,&ts);// May use vDSO, no syscall
}
Debugging and Inspection Tools
Identifying Mode Transitions
1. Using strace:
# Trace all syscalls (shows user->kernel transitions)strace -c ls -l
# Output:# % time seconds usecs/call calls errors syscall# ------ ----------- ----------- --------- --------- ----------------# 23.45 0.000234 234 1000 openat# 15.23 0.000152 152 1000 read# 10.12 0.000101 101 1000 close
# Attach to running kernel (requires kgdb)(gdb) target remote /dev/ttyS0
(gdb)break do_syscall_64
(gdb)continue# Breakpoint shows entry to kernel mode
Kernel Logging
Monitor mode transitions in kernel logs:
# Enable kernel debuggingecho8 > /proc/sys/kernel/printk # Enable all log levels# Watch for syscall-related messagesdmesg -w | grep -i "syscall\|fault\|segfault"
Common Pitfalls and Misconceptions
Misconception 1: “Kernel mode is always faster”
Reality: Mode transitions have overhead. Kernel mode itself isn’t faster; it’s necessary for privileged operations. User-space code can be faster for pure computation.
Misconception 2: “System calls are expensive”
Reality: Modern CPUs optimize syscall transitions. Overhead is typically 200-500 nanoseconds, negligible for most applications. I/O operations (disk, network) dominate latency, not syscall overhead.
Misconception 3: “Kernel code always runs in kernel mode”
Reality: Kernel code executes in kernel mode, but kernel threads can be scheduled like user processes. Interrupt handlers run in interrupt context, not process context.
Reality: User-space can access kernel memory through /proc, /sys, and mmap() of kernel-exported memory (e.g., /dev/mem with proper permissions). The kernel controls what is exposed.
References and Further Reading
Intel 64 and IA-32 Architectures Software Developer’s Manual: Volume 3A (System Programming Guide) - Privilege levels and protection
ARM Architecture Reference Manual: Exception levels and privilege model
Linux Kernel Source: arch/x86/entry/ (system call and interrupt entry code)
Understanding the Linux Kernel (3rd ed.): Chapter 1 (Introduction), Chapter 3 (Processes)
Linux Device Drivers (3rd ed.): Chapter 9 (Interrupt Handling)
man 2 syscalls: System call documentation
man 2 syscall: Generic system call wrapper
Note: The distinction between kernel mode and user mode is fundamental to operating system security and stability. All privileged operations must occur in kernel mode, while user applications run in isolated user mode with controlled access to system resources via system calls.
2.5 - Understanding CPU Statistics in Linux (/proc/stat)
Deep technical dive into CPU time accounting in Linux, covering user, nice, system, idle, iowait, irq, softirq, steal, guest, and guest_nice statistics with practical examples and kernel internals.
Kernel-Level CPU Time Accounting
Summary
The Linux kernel maintains precise, per-CPU time accounting across ten distinct execution contexts. These statistics, exposed via /proc/stat, represent cumulative jiffy counters (typically 1/100th or 1/1000th of a second) since system boot. Understanding these counters is essential for performance analysis, capacity planning, and diagnosing CPU contention, I/O bottlenecks, interrupt storms, and virtualization overhead.
The /proc/stat Interface
/proc/stat is a virtual file provided by the kernel’s proc filesystem. It contains system-wide statistics aggregated across all CPUs and individual per-CPU lines. The format is non-blocking and updated atomically by the kernel scheduler’s tick handler.
The first line (cpu) aggregates all CPUs; subsequent cpuN lines show per-CPU statistics. Each CPU line contains ten fields:
cpuX user nice system idle iowait irq softirq steal guest guest_nice
Note: All values are cumulative counters measured in jiffies (kernel ticks). To calculate percentages or rates, you must sample at two points in time and compute deltas.
Field-by-Field Breakdown
1. user (usr)
Kernel context: Time spent executing user-space code in normal priority processes.
Increment condition: Kernel tick handler (account_process_tick()) counts time when a process is running in user mode with default priority (nice value 0-0).
High system time indicates frequent syscalls or kernel processing
Typical range: 5-30% on normal systems
Spikes suggest I/O-bound workloads, context switching, or kernel-intensive operations
50% may indicate kernel bottlenecks or driver issues
Practical example:
# Monitor system call rate (indirectly via system time)T1=$(grep '^cpu ' /proc/stat | awk '{print $4}')strace -c -e trace=all sleep 1 2>&1| tail -1
T2=$(grep '^cpu ' /proc/stat | awk '{print $4}')echo"System time delta: $((T2 - T1)) jiffies"# High system time scenarios:# 1. Frequent file I/Odd if=/dev/urandom of=/tmp/test bs=4K count=10000# 2. Network operationscurl -s https://example.com > /dev/null
# 3. Process creationfor i in {1..1000};do true;done
Kernel code path:
// System time accounting during syscall
longsys_xyz(...){// Pre-syscall timestamp
account_system_time(current,cputime_before);// ... kernel work ...
account_system_time(current,cputime_after);}
4. idle
Kernel context: Time the CPU spent idle (no runnable tasks, waiting in idle loop).
Increment condition: Kernel idle loop (do_idle()) executes when the runqueue is empty. The idle task (PID 0, swapper) runs and increments this counter.
Kernel source:kernel/sched/idle.c::do_idle()
Example interpretation:
High idle = low CPU utilization
Idle time should decrease under load
100% - idle% ≈ total CPU utilization
On SMP systems, one CPU can be idle while others are busy
Kernel context: Time “stolen” by the hypervisor from a virtual CPU (only in virtualized environments).
Increment condition: Hypervisor preempts the guest VM’s virtual CPU to schedule other VMs or host tasks. The guest kernel detects this via paravirtualized time sources (e.g., KVM’s kvm_steal_time).
// Host side (KVM)
staticvoidrecord_steal_time(structkvm_vcpu*vcpu){structkvm_steal_time*st=vcpu->arch.st;st->steal+=current->sched_info.run_delay;}// Guest side (Linux kernel)
staticvoidkvm_steal_time_setup(void){// Read steal time from shared page
steal=st->steal;account_steal_time(steal);}
9. guest
Kernel context: Time spent running a guest OS (nested virtualization or KVM guest time accounting).
Increment condition: Host kernel accounts time when a guest VM’s virtual CPU is executing. This is the inverse of steal from the host’s perspective.
In nested virtualization, a guest VM can itself host VMs
Typically only relevant for hypervisor monitoring
Practical example:
# On a KVM host, monitor guest timewatch -n 1"grep '^cpu ' /proc/stat | awk '{print \"guest: \" \$10}'"# Compare with VM CPU usage (from host perspective)virsh domstats --cpu <domain>
Guest time accounting:
// When guest VM executes on host CPU
voidaccount_guest_time(structtask_struct*p,u64cputime){account_cputime_guest(p,cputime);// Guest time is also counted as user time from host perspective
account_user_time(p,cputime);}
10. guest_nice
Kernel context: Time spent running niced guest OS processes (nested virtualization).
Increment condition: Same as guest, but for processes with non-zero nice values in the guest.
Kernel source:kernel/sched/cputime.c::account_guest_time() with nice check
Kernel Source:kernel/sched/cputime.c (CPU time accounting implementation)
man proc(5):/proc/stat format documentation
Linux Performance and Tuning Guide: CPU accounting and analysis
Understanding the Linux Kernel (3rd ed.): Chapter 4 (Interrupts and Exceptions), Chapter 7 (Kernel Synchronization)
Note: All statistics are cumulative since boot. To calculate rates or percentages, always sample at two points in time and compute deltas. The kernel tick rate (HZ) determines counter resolution and can be queried via getconf CLK_TCK.