Find automation helpers and reference material that streamline Linux administration tasks.
This is the multi-page printable view of this section. Click here to print.
Administration
Tools and guides for administering Linux systems.
- 1: Linux Boot/Shutdown Quick-Analyzer
- 2: How Antivirus Software Can Prevent Linux Boot: Troubleshooting Guide
- 3: Understanding IO Delays in Linux - Performance Testing with io-delayer
- 4: Streamlining Linux Diagnostics with SOSParser
- 5: Linux Benchmarking Made Easy with Tux Toaster
1 - Linux Boot/Shutdown Quick-Analyzer
Parse Linux boot and shutdown events from system and serial console logs.
What is Linux Boot/Shutdown Quick-Analyzer and why do you need it?
The Linux Boot/Shutdown Quick-Analyzer is a Python script that analyzes Linux boot and shutdown logs.
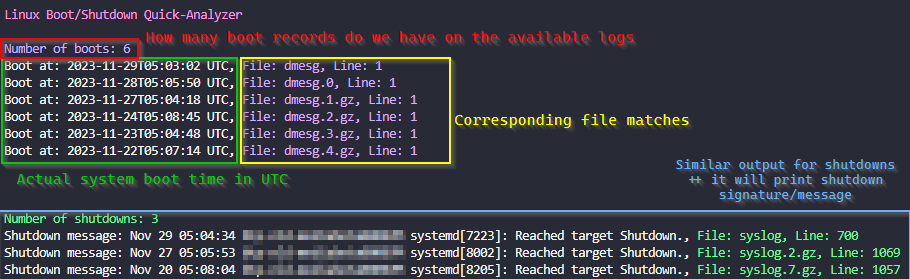
It makes it easy to find boot and shutdown events in system logs, providing information such as the number of boot and shutdown events, along with the timestamp, filename, and line number for each event.
How to run it
You need to have Python 3 installed on your machine.
To use the script, navigate to the directory containing your logs (usually /var/log) and run the following command:
# Make sure you are working inside your system logs dir
cd /var/log

# Execute the script
curl https://raw.githubusercontent.com/samatild/linuxrebootcheck/main/linuxrebootcheck.py | python3
Special arguments for special Serial Console logs!
What about those logs that are not in the usual format?
To analyze Serial Console file, you need to download the script and use the –serial-console-log argument followed by the filename:
curl -O https://raw.githubusercontent.com/samatild/linuxrebootcheck/main/linuxrebootcheck.py
python3 linuxrebootcheck.py --serial-console-log <your_log_file>
Conclusion
Overall, the Linux Boot/Shutdown Quick-Analyzer is a useful tool for analyzing Linux boot and shutdown logs. It provides a quick and easy way to find boot and shutdown events in system logs, making it easier to troubleshoot issues and identify potential problems. If you’re looking for a simple and efficient way to analyze your system logs, give it a try!
Source
2 - How Antivirus Software Can Prevent Linux Boot: Troubleshooting Guide
Learn how antivirus software can interfere with Linux system boot, including readonly filesystem problems, LSM conflicts, and CrowdStrike Falcon Sensor troubleshooting.
Understanding Antivirus Boot Interference
Antivirus software, while crucial for system security, can sometimes interfere with the Linux boot process. This occurs when security modules become overly aggressive during system initialization, potentially causing boot failures, readonly filesystem mounts, or service startup issues.
Common Symptoms
- System fails to boot completely
- Filesystem mounts as readonly (
ro) instead of read-write (rw) - Critical services fail to start
- Boot hangs at specific points
- SELinux/AppArmor policy violations during boot
Filesystem Readonly Issues
One of the most common problems occurs when antivirus software causes the root filesystem to mount readonly. This prevents the system from writing critical boot files and can halt the initialization process.
Root Cause Analysis
Antivirus software often implements filesystem integrity checking or real-time scanning that can interfere with:
- Journal replay during filesystem mounting
- Metadata updates during boot
- Temporary file creation in
/tmp,/var,/run
Example Scenarios
Scenario 1: Journal Corruption Detection
[   12.345678] EXT4-fs (sda1): INFO: recovery required on readonly filesystem
[   12.345678] EXT4-fs (sda1): write access unavailable, cannot proceed
[   12.345678] EXT4-fs (sda1): recovery failed, mounting readonly
Scenario 2: Real-time Scanner Blocking Writes
[   15.678901] systemd[1]: Failed to start Local File Systems.
[   15.678901] systemd[1]: Dependency failed for Remote File Systems.
[   15.678901] mount[1234]: mount: / cannot be mounted read-write
Recovery Steps
- Boot into recovery mode or single-user mode:
# At GRUB menu, press 'e' to edit
# Add 'single' or 'recovery' to kernel parameters
linux /boot/vmlinuz-... ro single
- Check filesystem integrity:
# Run filesystem check
fsck -f /dev/sda1

# If issues persist, check dmesg for antivirus-related messages
dmesg | grep -i "antivirus\|security\|scanner"
- Temporarily disable antivirus during boot:
# For systemd-based systems, mask the service temporarily
systemctl mask antivirus-service-name
systemctl reboot
Linux Security Modules (LSM) Conflicts
Linux Security Modules (LSM) provide the framework for security subsystems like SELinux, AppArmor, and various antivirus solutions. When multiple LSMs are active or improperly configured, they can conflict during boot.
LSM Architecture Overview
LSM hooks into the kernel at critical points:
- Process creation and execution
- File access operations
- Network operations
- Memory management
Common LSM Boot Conflicts
SELinux + Antivirus LSM:
- Both may attempt to enforce policies on the same resources
- Race conditions during policy loading
- Conflicting access decisions
AppArmor Profile Loading:
[FAILED] Failed to load AppArmor profiles
[FAILED] apparmor.service: Main process exited, code=exited, status=1/FAILURE
Troubleshooting LSM Issues
- Check LSM status:
# View active LSMs
cat /sys/kernel/security/lsm

# Check SELinux status
sestatus

# Check AppArmor status
apparmor_status
- Boot with permissive mode:
# For SELinux
linux /boot/vmlinuz-... selinux=0

# For AppArmor
linux /boot/vmlinuz-... apparmor=0
- Review security logs:
# Check audit logs for LSM denials
ausearch -m avc -ts boot

# View journal for security module errors
journalctl -b | grep -i "security\|lsm\|selinux\|apparmor"
CrowdStrike Falcon Sensor Boot Issues
CrowdStrike Falcon Sensor is a common enterprise antivirus solution that can cause boot problems when misconfigured. The sensor requires proper licensing and network connectivity to function correctly.
The Critical Error
When CrowdStrike Falcon Sensor fails during boot, you may see:
[FAILED] Failed to start CrowdStrike Falcon Sensor.
This failure can cascade into other issues:
- System may continue booting but without security protection
- Network services may fail if the sensor blocks them
- Filesystem operations may be restricted
Root Causes
- Missing or invalid license
- Network connectivity issues during sensor initialization
- Conflicting security policies
- Outdated sensor version
- Improper installation or configuration
Immediate Fix: Masking the Service
When the CrowdStrike service fails and blocks system access, you can temporarily mask it to allow the system to boot:
# Check the exact service name
systemctl list-units --all | grep -i crowdstrike

# Mask the service to prevent automatic startup
sudo systemctl mask falcon-sensor

# Reboot the system
sudo systemctl reboot
Permanent Solutions
- Verify licensing:
# Check CrowdStrike status
/opt/CrowdStrike/falconctl -g --cid

# If CID is missing, contact your administrator
- Update sensor:
# Update CrowdStrike sensor
/opt/CrowdStrike/falconctl -s --update

# Or reinstall if update fails
- Network configuration:
# Ensure DNS resolution works
nslookup falcon.crowdstrike.com

# Check proxy settings if applicable
env | grep -i proxy
- Configuration validation:
# Check sensor configuration
/opt/CrowdStrike/falconctl -g --tags
/opt/CrowdStrike/falconctl -g --version
Prevention Best Practices
- Test updates in staging environments
- Maintain current licensing
- Monitor sensor health regularly
- Have rollback procedures documented
General Troubleshooting Framework
Boot Analysis Steps
- Collect boot logs:
# View current boot logs
journalctl -b

# Save logs for analysis
journalctl -b > boot_logs.txt
- Identify the failing component:
# Check failed services
systemctl --failed

# Review systemd boot timeline
systemd-analyze blame
- Isolate antivirus components:
# List security-related services
systemctl list-units --type=service | grep -E "(security|antivirus|falcon|clamav)"

# Temporarily disable for testing
sudo systemctl stop antivirus-service
sudo systemctl disable antivirus-service
Recovery Options
Option 1: Clean Boot
- Disable all non-essential services
- Boot with minimal security modules
- Gradually re-enable components
Option 2: Recovery Environment
- Use live USB/CD for filesystem repair
- Access encrypted volumes if necessary
- Reinstall antivirus software if corrupted
Option 3: Kernel Parameters
# Boot parameters for troubleshooting
linux /boot/vmlinuz-... ro quiet splash security= selinux=0 apparmor=0
Prevention and Best Practices
System Configuration
- Proper service ordering:
# Ensure antivirus starts after critical filesystems
# Edit service files to add proper dependencies
systemctl edit antivirus-service
- Exclude system paths:
# Configure antivirus to exclude boot-critical paths
# Examples: /boot, /sys, /proc, /dev
- Regular maintenance:
# Update antivirus definitions
antivirus-update-command

# Monitor system logs for early warnings
logwatch --service antivirus
Monitoring and Alerting
- Set up log monitoring for antivirus-related errors
- Configure alerts for service failures
- Regular health checks of security components
- Documentation of emergency procedures
Conclusion
Antivirus software is essential for Linux security but requires careful configuration to avoid boot interference. Understanding LSM interactions, filesystem behavior, and specific tool requirements (like CrowdStrike Falcon Sensor) is crucial for maintaining system stability.
When issues occur, systematic troubleshooting—starting with log analysis and service isolation—usually reveals the root cause. Temporary fixes like service masking provide immediate relief while permanent solutions address underlying configuration problems.
Remember: security and stability aren’t mutually exclusive with proper planning and monitoring.
Related Resources
3 - Understanding IO Delays in Linux - Performance Testing with io-delayer
A deep dive into Linux IO performance degradation using kernel modules to simulate VFS and block device delays, with engineering analysis of path resolution and queue congestion impacts.
Simulate and analyze IO performance degradation at multiple kernel layers to understand system bottlenecks.
Why IO Delays Matter in System Performance
Input/Output operations form the backbone of system performance, yet they represent one of the most complex and often misunderstood aspects of Linux performance engineering. When applications experience slowdowns, the root cause frequently traces back to IO delays introduced at various kernel layers.
The io-delayer kernel module provides a controlled environment to study these delays, helping engineers understand how different types of IO interception impact overall system performance.
The io-delayer Tool
io-delayer is a Linux kernel module that demonstrates IO performance degradation by intercepting operations at two critical kernel layers:
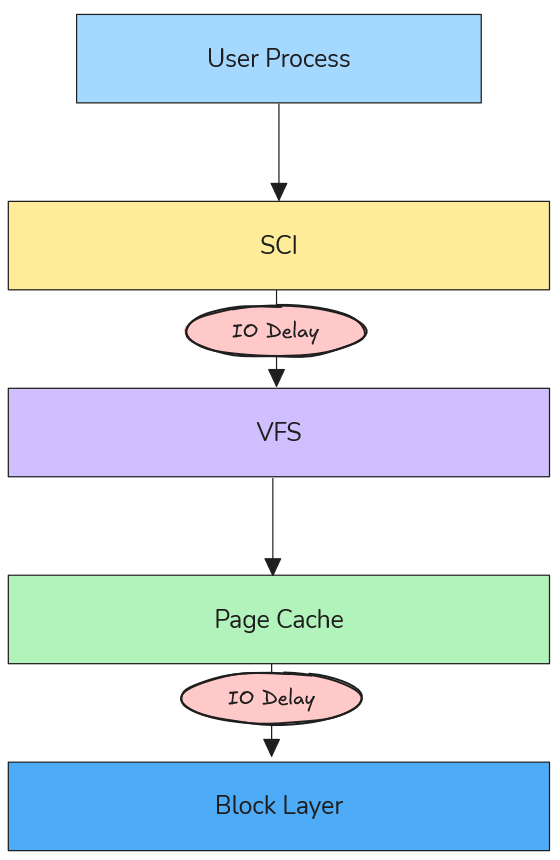
Figure: Visualization of IO delays at different Linux kernel layers (VFS vs Block Device).
- VFS (Virtual File System) Layer: Where path resolution and high-level file operations occur
- Block Device Layer: Where actual storage device interactions happen
Using kprobes, the module inserts configurable microsecond delays into the IO path, allowing precise measurement of performance impact across different scenarios.
VFS Layer Delays: The Path Resolution Bottleneck
Understanding VFS in the IO Stack
The Virtual File System layer sits between system calls and actual filesystem implementations. When an application calls open(), read(), or write(), these requests pass through VFS before reaching storage devices.
According to the Linux kernel VFS documentation, VFS provides a unified interface that abstracts different filesystem types while handling core operations like:
- Path name resolution (translating
/home/user/file.txtto inode references) - Permission checking
- File descriptor management
- Caching coordination
How VFS Delays Degrade Performance
VFS delays primarily impact path resolution times, which become critical in scenarios involving:
1. Directory Traversal Operations
// Every path component requires VFS resolution
int fd = open("/home/user/documents/large-dataset/file-001.dat", O_RDONLY);
Each directory in the path (home, user, documents, large-dataset) triggers VFS operations. A 100μs delay per VFS call on a deep path like /var/lib/docker/containers/... can accumulate to milliseconds.
2. Metadata-Heavy Workloads
Applications that perform many stat() calls or directory listings suffer disproportionately:
- Package managers during dependency resolution
- File browsers indexing directories
- Backup tools scanning filesystem trees
3. Process Startup Overhead
Binary execution involves resolving library paths through VFS:
# Dynamic linker resolves ~50-100 library paths per process start
execve("/usr/bin/python3", ...)
Real-World VFS Delay Scenarios
Antivirus Software Impact: Modern endpoint protection often hooks VFS operations to scan files during access. A 50-200μs delay per file operation can make boot times 2-3x slower.
Container Filesystem Overhead: Docker’s layered filesystem adds VFS traversal through multiple overlay layers. Additional delays here compound with existing virtualization overhead.
Network Filesystem Latency: NFS and CIFS clients already introduce network round-trips; VFS delays can make interactive applications feel unresponsive.
Block Device Layer Delays: Queue Congestion Dynamics
Block Device Architecture
Below VFS lies the block device layer, responsible for managing IO queues, scheduling, and hardware interaction. The Linux block IO subsystem uses:
- IO Schedulers: CFQ, deadline, noop, mq-deadline
- Request Queues: Buffering and reordering IO requests
- Elevator Algorithms: Optimizing disk head movement patterns
Queue Congestion Mechanics
Block device delays create queue congestion that affects the entire storage subsystem:
1. Request Queue Backlog
// Block device delays cause queue depth to increase
// Normal queue depth: 1-32 requests
// With delays: Can exceed 1000+ pending requests
When delays are introduced at the block layer, incoming requests accumulate faster than they can be processed, leading to:
- Memory Pressure: IO requests consume kernel memory
- Increased Latency: Requests wait longer in queue
- Throughput Degradation: Device saturation occurs at lower loads
2. IO Scheduler Inefficiency
Modern IO schedulers optimize for:
- Seek Time Minimization: Grouping nearby requests
- Fairness: Preventing starvation between processes
- Priority Handling: Real-time vs. normal priority requests
Delays disrupt these optimizations, causing schedulers to make suboptimal decisions.
3. Cascading Effects
Block delays create feedback loops:
- Delays increase queue depth
- Deeper queues increase average wait time
- Higher latency causes applications to issue more concurrent requests
- More concurrency deepens queues further
Real-World Block Device Scenarios
Storage Security Appliances: Enterprise storage systems with inline deduplication, compression, or encryption add block-level delays. Understanding these helps size hardware appropriately.
Virtualization Storage Stacks: Hypervisor storage filters, vSAN layers, and distributed storage introduce block delays that compound with virtualization overhead.
Hardware RAID Controllers: Battery-backed write caches and consistency checks add measurable delays that affect application performance expectations.
Engineering Methodology: Testing with io-delayer
Installation and Setup
# Clone the repository
git clone https://github.com/samatild/io-delayer.git
cd io-delayer

# Build and install (requires kernel headers)
make all
sudo make install
sudo make load
VFS Delay Testing
# Set 100 microsecond VFS delay
sudo ./io-delayer-cli set 100

# Test path resolution impact
time find /usr -name "*.so" 2>/dev/null | head -10

# Measure application startup time
time python3 -c "import sys; print('Python started')"
Block Device Delay Testing
# Set 500 microsecond block device delay
sudo ./io-delayer-cli set-blk 500

# Test sequential throughput
dd if=/dev/zero of=/tmp/test bs=1M count=100

# Test random IO performance
fio --name=randread --rw=randread --bs=4k --size=1G --numjobs=4 --runtime=30
Performance Analysis Techniques
1. SystemTap/BPF Tracing
# Trace VFS operations with delays
stap -e '
probe vfs.read.return {
  if (execname() == "target_app") {
    printf("%s: VFS read latency %d us\n", execname(), gettimeofday_us() - @entry(gettimeofday_us()));
  }
}
'
2. IO Queue Monitoring
# Monitor block device queue depths
iostat -x 1

# Check /proc/diskstats for queue congestion
cat /proc/diskstats | grep sda
3. Flame Graph Analysis
# Generate IO flame graphs during testing
perf record -F 99 -a -g -- sleep 30
perf script | stackcollapse-perf.pl | flamegraph.pl > io-flame.svg
Real-World Engineering Applications
Security Software Performance Characterization
Understanding VFS delays helps security teams balance protection with performance:
# Simulate antivirus overhead
sudo ./io-delayer-cli set 150  # 150μs per file operation

# Test impact on common workflows
time grep -r "pattern" /var/log/  # Log analysis
time find /home -name "*.pdf"     # Document indexing
Key Insight: 100-200μs VFS delays can make interactive applications feel “sluggish,” explaining user complaints about security software impact.
Storage System Capacity Planning
Block device delays help size storage arrays:
# Simulate storage appliance latency
sudo ./io-delayer-cli set-blk 2000  # 2ms storage latency

# Test application tolerance
fio --name=oltp_simulation --rw=randrw --rwmixread=70 --bs=8k --size=10G --numjobs=8 --runtime=300
Key Insight: Applications tolerant of 1-2ms latency can handle most enterprise storage, but 5+ms delays require architectural changes.
Container Performance Optimization
Docker and Kubernetes environments add multiple IO layers:
# Simulate container filesystem overhead
sudo ./io-delayer-cli set 50   # OverlayFS traversal
sudo ./io-delayer-cli set-blk 100  # Storage driver delays

# Test container startup time
time docker run --rm hello-world
Key Insight: Container startup times degrade linearly with VFS delays, explaining performance differences between bare metal and containerized deployments.
Kernel Implementation Details
Kprobe Integration
The module uses kprobes to intercept kernel functions without modification:
// VFS layer hooking
static struct kprobe kp_vfs_read = {
    .symbol_name = "vfs_read",
    .pre_handler = pre_handler_vfs_read,
};

// Block device layer hooking
static struct kprobe kp_blk_start_request = {
    .symbol_name = "blk_start_request",
    .pre_handler = pre_handler_blk_start_request,
};
Delay Injection Mechanism
static void inject_delay(unsigned int delay_us)
{
    if (delay_us > 0) {
        udelay(delay_us);
    }
}
This uses udelay() for microsecond-precision delays, calibrated against the system timer.
Sysfs Interface
Runtime configuration via sysfs:
# VFS delay control
/sys/kernel/io_delayer/vfs_delay_us
# Block device delay control
/sys/kernel/io_delayer/blk_delay_us
Performance Benchmarking Best Practices
Controlled Testing Environment
- Baseline Measurement: Always establish performance without delays first
- Incremental Testing: Start with small delays (10-50μs) and increase gradually
- Statistical Analysis: Run tests multiple times, use percentiles over averages
- System Monitoring: Track CPU usage, memory pressure, and IO queue depths
Realistic Delay Values
Based on real-world measurements:
- VFS delays: 10-200μs (antivirus, DLP software)
- Block delays: 100-2000μs (storage appliances, encryption)
- Network delays: 50-500μs (WAN acceleration, proxy servers)
Performance Metrics to Monitor
# System-level metrics
vmstat 1
iostat -x 1
sar -u 1

# Application-level timing
strace -c -p $(pidof target_app)
perf stat -p $(pidof target_app)
Troubleshooting and Validation
Verifying Module Operation
# Check module loading
lsmod | grep io_delayer

# Verify kprobe attachment
cat /sys/kernel/debug/kprobes/list | grep io_delayer

# Monitor delay settings
cat /sys/kernel/io_delayer/vfs_delay_us
cat /sys/kernel/io_delayer/blk_delay_us
Performance Impact Assessment
# Before delays (baseline)
sudo ./io-delayer-cli set 0
sudo ./io-delayer-cli set-blk 0
fio --name=baseline --rw=randread --bs=4k --size=1G --runtime=30 --output=baseline.json

# With VFS delays
sudo ./io-delayer-cli set 100
fio --name=vfs_delayed --rw=randread --bs=4k --size=1G --runtime=30 --output=vfs_delayed.json

# With block device delays
sudo ./io-delayer-cli set 0
sudo ./io-delayer-cli set-blk 500
fio --name=blk_delayed --rw=randread --bs=4k --size=1G --runtime=30 --output=blk_delayed.json

# Calculate degradation - compare IOPS, latency percentiles, CPU usage
Security and Production Considerations
Important: This module is for testing purposes only. Production use can cause system instability or data loss.
- Requires root privileges for installation
- Can impact system responsiveness during high-delay testing
- Not intended for security enforcement (unlike actual antivirus software)
- MIT licensed for educational and research use
Advanced Use Cases
Custom Kernel Instrumentation
The module serves as a template for building custom IO tracing tools:
// Add custom probes for specific filesystems
static struct kprobe kp_ext4_writepages = {
    .symbol_name = "ext4_writepages",
    .pre_handler = custom_ext4_handler,
};
Performance Regression Testing
# Automated testing script
#!/bin/bash
for delay in 0 50 100 200; do
    sudo ./io-delayer-cli set $delay
    sudo ./io-delayer-cli set-blk $delay

    # Run your favorite benchmark utility (fio, tuxtoaster, etc.)
    echo "Testing with ${delay}us delays..."
    fio --name=regression_test --rw=randrw --rwmixread=70 --bs=4k --size=1G --runtime=30 --output=results_${delay}us.json

    # Or use tuxtoaster for comprehensive system testing
    # tuxtoaster --category disk --test "Random IOPS R/W"

    # Reset delays between tests
    sudo ./io-delayer-cli set 0
    sudo ./io-delayer-cli set-blk 0
    sleep 5
done
Conclusion
The io-delayer kernel module provides essential visibility into how IO delays at different kernel layers impact overall system performance. By understanding VFS path resolution bottlenecks and block device queue congestion, engineers can make informed decisions about:
- Security software deployment strategies
- Storage system architecture choices
- Container performance optimization
- Application performance expectations
The tool bridges the gap between theoretical kernel knowledge and practical performance engineering, enabling data-driven decisions in complex Linux environments.
Key Takeaways:
- VFS delays primarily affect interactive performance through path resolution overhead
- Block device delays create queue congestion that impacts throughput and scalability
- Real-world delays range from microseconds (software) to milliseconds (hardware)
- Systematic testing with tools like
io-delayerprevents performance surprises
Learn More & References
- Project Repository:
github.com/samatild/io-delayer - Linux VFS Documentation:
kernel.org/doc/html/latest/filesystems/vfs.html - Block IO Subsystem:
kernel.org/doc/html/latest/block/index.html - Kprobes Documentation:
kernel.org/doc/html/latest/trace/kprobes.html
4 - Streamlining Linux Diagnostics with SOSParser
A comprehensive guide to using SOSParser, an automated analysis tool for Linux sosreport and supportconfig diagnostic files.
GitHub • Docker Hub •
Parse, analyze, and understand Linux diagnostic reports with automated intelligence.
What is SOSParser?
SOSParser is a powerful web application designed to automatically parse and analyze Linux sosreport and supportconfig diagnostic files, converting them into comprehensive, interactive HTML reports. Created to streamline the often tedious process of manually reviewing system diagnostic data, SOSParser transforms raw diagnostic archives into structured, searchable insights that accelerate troubleshooting and system analysis.
Whether you’re a system administrator, DevOps engineer, or support technician dealing with complex Linux environments, SOSParser provides an automated approach to understanding what’s happening inside your systems.

The Problem SOSParser Solves
When Linux systems encounter issues, the standard diagnostic approach involves generating comprehensive reports using tools like:
sosreport- A utility that collects detailed system information from Red Hat-based distributionssupportconfig- SUSE’s equivalent diagnostic collection tool
These reports contain thousands of files with critical system information, but analyzing them manually is:
- Time-consuming: Hours of sifting through logs, configurations, and system data
- Error-prone: Easy to miss important correlations between different system components
- Inconsistent: Different analysts may interpret the same data differently
- Repetitive: Common patterns and issues require rediscovery each time
SOSParser addresses these challenges by providing automated, intelligent analysis that surfaces key insights immediately.
How SOSParser Works
Input Processing
SOSParser accepts standard diagnostic archives in various compressed formats:
.tar.xz(most common).tar.gz.tar.bz2.tar
Analysis Pipeline
Once uploaded, SOSParser processes the diagnostic data through multiple analysis modules:
- Data Extraction: Automatically unpacks and organizes the diagnostic archive
- Content Parsing: Extracts and structures data from hundreds of system files
- Correlation Analysis: Identifies relationships between different system components
- Insight Generation: Applies heuristics and rules to identify potential issues
- Report Generation: Creates an interactive HTML report with visualizations and recommendations
What SOSParser Analyzes
System Information
- Hardware Details: CPU architecture, memory configuration, disk layout
- OS Information: Distribution, version, kernel details
- System Resources: Current utilization, capacity planning insights
System Configuration
- Boot Configuration: GRUB settings, init systems, startup services
- Authentication: PAM configuration, user management, security policies
- Services: Systemd units, cron jobs, running processes
- Security: SELinux/AppArmor status, firewall rules, package integrity
Filesystem Analysis
- Mount Points: Filesystem types, mount options, capacity usage
- LVM Configuration: Volume groups, logical volumes, physical volumes
- Disk Usage: Largest directories, file ownership patterns, permission issues
- Filesystem Health: Journal status, inode usage, fragmentation indicators
Network Analysis
- Interface Configuration: IP addresses, subnet masks, gateway settings
- Routing Tables: Static and dynamic routes, network connectivity
- DNS Configuration: Resolvers, search domains, DNS query patterns
- Firewall Rules: iptables/nftables configuration, active rulesets
- Network Services: Listening ports, connection states, network statistics
Log Analysis
- System Logs:
/var/log/messages,/var/log/syslog, journald entries - Kernel Logs:
dmesgoutput, kernel ring buffer analysis - Authentication Logs: Login attempts, sudo usage, security events
- Service Logs: Application-specific log analysis and error pattern detection
- Security Events: Failed access attempts, intrusion indicators
Cloud Services Integration
- AWS: EC2 instance metadata, IAM roles, VPC configuration
- Azure: VM extensions, resource groups, networking setup
- GCP: Compute Engine metadata, service accounts, network configuration
- Oracle Cloud: Instance details, VNICs, storage configuration
Getting Started with SOSParser
Docker Deployment (Recommended)
The easiest way to run SOSParser is using Docker:
# Pull the official image
docker pull samuelmatildes/sosparser:latest

# Run the container
docker run -d -p 8000:8000 --name sosparser samuelmatildes/sosparser:latest
Then open http://localhost:8000 in your browser.
Persisting Data
For production use, mount volumes to persist uploads and generated reports:
# Using bind mounts
docker run -d -p 8000:8000 --name sosparser \
  -v $(pwd)/data/uploads:/app/webapp/uploads \
  -v $(pwd)/data/outputs:/app/webapp/outputs \
  samuelmatildes/sosparser:latest

# Using named volumes
docker run -d -p 8000:8000 --name sosparser \
  -v sosparser_uploads:/app/webapp/uploads \
  -v sosparser_outputs:/app/webapp/outputs \
  samuelmatildes/sosparser:latest
Local Development
To build and run locally:
git clone https://github.com/samatild/SOSParser.git
cd SOSParser
docker build -t sosparser:local .
docker run -d -p 8000:8000 sosparser:local
Using SOSParser
Web Interface Workflow
- Upload: Select your
sosreportorsupportconfigfile (supports multiple formats) - Analyze: Click “Analyze Report” to start automated processing
- Review: Browse the generated interactive HTML report
- Export: Download reports for sharing or archival
Report Features
The generated reports include:
- Interactive Navigation: Collapsible sections, searchable content
- Visual Indicators: Color-coded severity levels for issues
- Cross-References: Links between related system components
- Recommendations: Actionable suggestions based on findings
- Export Options: PDF generation, data extraction
Common Use Cases
Incident Response
- Rapid triage of production system issues
- Correlation of symptoms across multiple subsystems
- Identification of root cause patterns
Capacity Planning
- Resource utilization analysis
- Performance bottleneck identification
- Growth trend assessment
Security Audits
- Configuration compliance checking
- Vulnerability assessment
- Access pattern analysis
Change Validation
- Pre/post-change comparison
- Configuration drift detection
- Impact assessment
Advanced Features and Roadmap
Currently Available
- Multi-format diagnostic file support
- Cloud platform detection and analysis
- Comprehensive system health scoring
- Interactive HTML report generation
Planned Enhancements
- Advanced Disk Diagnostics: SMART data analysis, ATA command integration
- Application Server Analysis: Apache/Nginx configuration parsing, database connectivity
- Container Orchestration: Kubernetes pod analysis, Docker container inspection
- Backup System Integration: Backup status validation, recovery testing
- Monitoring Integration: Prometheus metrics correlation, alerting rule validation
- Machine Learning: Anomaly detection, predictive issue identification
Performance and Scalability
SOSParser is designed to handle large diagnostic reports efficiently:
- Processing Speed: Most reports analyzed in under 2 minutes
- Memory Usage: Optimized for systems with 2GB+ RAM
- Storage: Reports typically 10-20% of original archive size
- Concurrency: Supports multiple simultaneous analyses
Security Considerations
- Local Processing: All analysis occurs locally - no data sent to external services
- Container Isolation: Docker deployment provides additional security boundaries
- Data Privacy: Sensitive information remains within your infrastructure
- Audit Trail: Processing logs available for compliance requirements
Integration and Automation
API Access
SOSParser provides REST API endpoints for integration with existing workflows:
# Upload and analyze via API
curl -X POST -F "[email protected]" http://localhost:8000/api/analyze
CI/CD Integration
- Automated analysis of system snapshots
- Regression testing for configuration changes
- Compliance validation pipelines
Monitoring Integration
- Alert generation based on analysis results
- Dashboard integration for system health overview
- Trend analysis across multiple systems
Contributing and Community
SOSParser is an open-source project that welcomes contributions:
- Bug Reports: Use GitHub Issues for problems or feature requests
- Code Contributions: Pull requests are reviewed and merged regularly
- Documentation: Help improve guides and examples
- Testing: Report compatibility with different Linux distributions
Join the community on Telegram for updates, discussions, and support.
Troubleshooting SOSParser
Common Issues
Upload Failures
- Check file size limits (typically 500MB max)
- Verify archive integrity before upload
- Ensure proper file permissions
Analysis Errors
- Confirm the diagnostic file was generated correctly
- Check for corrupted archives
- Review Docker logs for processing errors
Performance Issues
- Allocate sufficient CPU and memory resources
- Process large reports during off-peak hours
- Consider horizontal scaling for high-volume environments
Conclusion
SOSParser represents a significant advancement in Linux system diagnostics, transforming the traditionally manual and time-intensive process of analyzing sosreport and supportconfig files into an automated, intelligent workflow. By providing comprehensive analysis, actionable insights, and interactive reports, it empowers system administrators and support teams to resolve issues faster and maintain healthier Linux environments.
Whether you’re managing a single server or overseeing enterprise-scale deployments, SOSParser provides the tools needed to understand your systems at a deeper level, identify potential issues before they become critical, and maintain optimal system health.
Learn More
- Project Repository:
github.com/samatild/SOSParser - Docker Hub:
hub.docker.com/r/samuelmatildes/sosparser - Issue Tracker: GitHub Issues
5 - Linux Benchmarking Made Easy with Tux Toaster
A practical guide to stress testing and benchmarking Linux systems using the Tux Toaster toolkit.
Benchmark smarter, not harder — with Tux Toaster.
What is Tux Toaster?
Tux Toaster is an all-in-one performance toolkit for Linux. It triggers various load tests (“toasters”) to help you evaluate the performance and stability of your system across CPU, memory, disk, and network. It offers an interactive terminal menu with multi-select support and clear, stoppable workloads.
When to use it
- Hardware bring-up and burn-in
- Post-maintenance validation (kernel/firmware/driver updates)
- Capacity planning and instance comparison
- Performance regressions investigations
- Reproducible stress scenarios for bug reports
Requirements
Tux Toaster targets Linux and relies on:
- Python 3.8+
- System utilities:
dd,lsblk,taskset,pkill - Internet connectivity for network tests
Optional/privileged:
- Root privileges for the “Unclean GC” runaway memory test to adjust
oom_score_adj
Installation
Install from PyPI (recommended):
pip install tuxtoaster
tuxtoaster
If your shell cannot find tuxtoaster, add the install directory to PATH:
# User installs (scripts in ~/.local/bin)
export PATH="$HOME/.local/bin:$PATH"
Alternative: install from source (editable):
git clone https://github.com/samatild/tuxtoaster.git
cd tuxtoaster
pip install -U pip setuptools wheel
pip install -e .
tuxtoaster
Menu controls:
- Use arrow keys to navigate, Enter to select.
- Many submenus support multi-select; hints appear in the UI.
- Press
q,x, orEscin a menu to go back. - During tests, press Enter to stop.
Quick start
From the main menu, pick a category and test(s) to run.
CPU
- Single Core
- All Cores
- Custom Number of Cores (uses
taskset; experimental)
Memory
- Single Runaway Thread
- Multiple Runaway Threads
- Memory spikes
- Unclean GC (requires root to set
oom_score_adj)
Disk
- IOPS Reads (4K, direct I/O)
- IOPS Writes (4K, direct I/O)
- Random IOPS R/W (4K, direct I/O)
- IOPS 50-50 R/W (4K, direct I/O)
- Throughput Reads (4MB, direct I/O)
- Throughput Writes (4MB, direct I/O)
- Random Throughput R/W (4MB, direct I/O)
- Throughput 50-50 R/W (4MB, direct I/O)
- Read while write cache is getting flushed
Network
- Network IN (Single) — downloads
https://proof.ovh.net/files/100Mb.dat - Network OUT (Single) — UDP to
8.8.8.8:53 - Network IN (Multiple) — N parallel downloads
- Network OUT (Multiple) — N parallel UDP senders
- Socket Exhaustion — exhaust process/kernel sockets or reserve listener port ranges
- Simulate Latencies — local TCP proxy that injects base latency and jitter (check project Git for instructions)
Multiple tests at once
Run CPU, Memory, Network, and Disk concurrently:
- From the main menu: Multiple → select items with SPACE → Enter to start.
- Press Enter to stop all running tests.
Behaviors:
- CPU: one busy process per core (like All Cores)
- Memory: threads allocate 500 MB chunks repeatedly (requires
psutil) - Network: continuous download of
https://proof.ovh.net/files/100Mb.dat - Disk: alternating
ddread/write with 4MB direct I/O under a temp file
Reading results
Tux Toaster prints live progress and a summary when you stop a test. Disk tests create temporary files under a dedicated directory on the selected mount points and clean up on exit. Network tests report bandwidth per socket in multi-socket modes.
Tips:
- Run tests at least 3 times and use medians for comparisons.
- Keep a record of CPU governor, kernel version, microcode, and thermal state.
- Pin CPU frequency when comparing hardware to reduce variance.
Good benchmarking hygiene
- Stop noisy services (package updates, indexing, backup agents)
Troubleshooting
- Missing
psutil:pip3 install psutil - Permission errors: some memory tests and
tasksetpinning may requiresudo - Inconsistent results: check CPU governor, temperature, and background load
- Direct I/O errors: some filesystems/containers may not honor
oflag=direct
Learn more
- Project:
github.com/samatild/tuxtoaster - PyPI:
pypi.org/project/tuxtoaster - Issues/feedback: open a GitHub issue with your logs and command line