Prepare a system to collect crash dumps before a kernel panic occurs
Understand why a machine hung, soft-locked, or hard-locked
Learn how privilege levels and system calls shape performance and security behavior
Investigate CPU statistics and kernel symptoms with better context
1 - Soft and Hard Lockups
Detect, troubleshoot, and simulate Linux kernel soft and hard lockups with the watchdog.
Introduction
Kernel Watchdog
According to Linux Kernel Documentation, the Linux kernel can act as a watchdog to detect both soft and hard lockups.
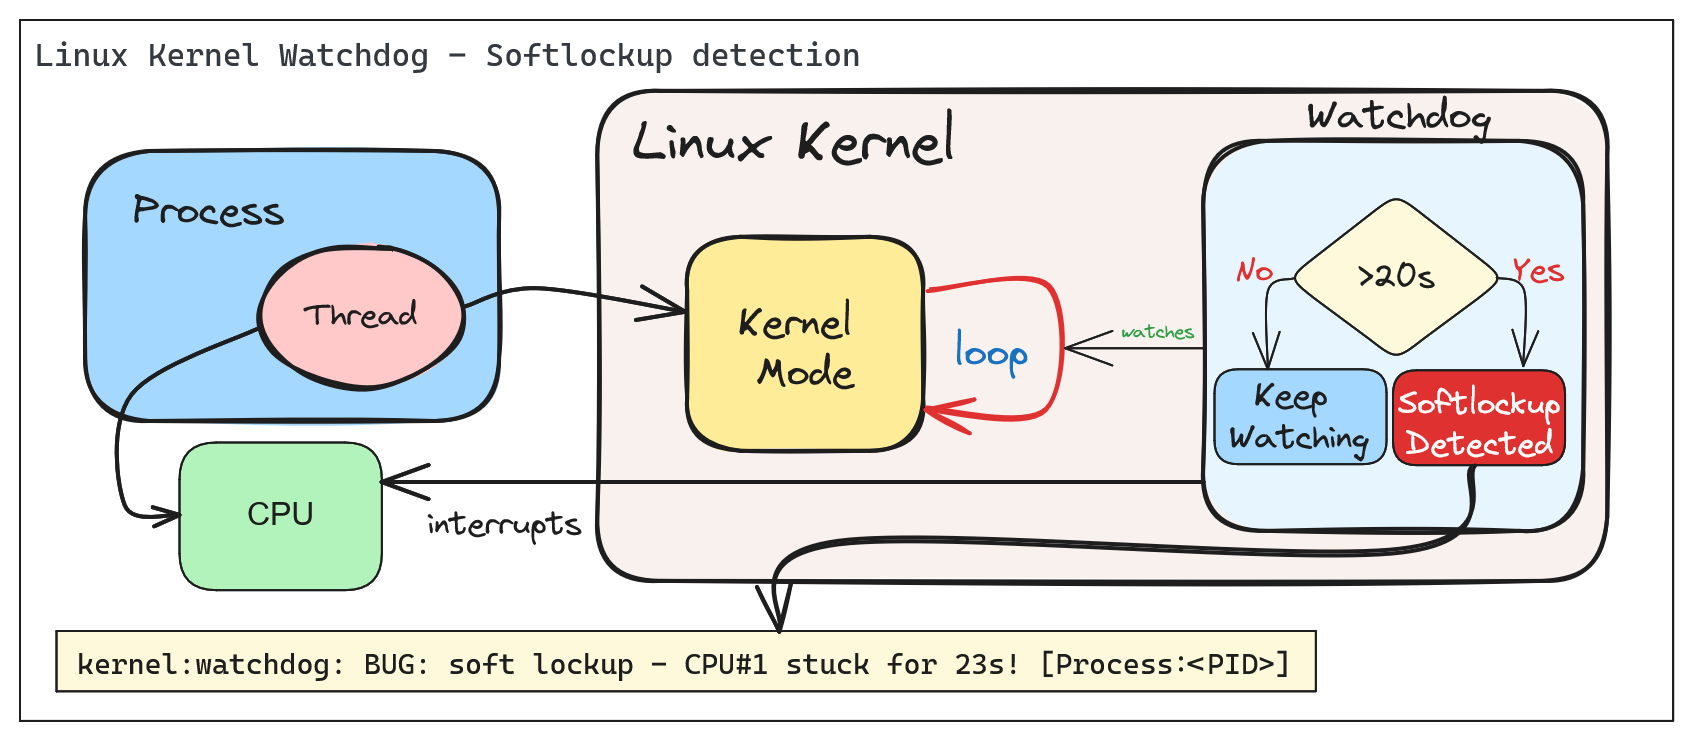
The Linux Kernel Watchdog is a mechanism that monitors the system for both soft and hard lockups. It is designed to detect when a CPU is stuck in a loop and unable to make progress. When a soft lockup is detected, the watchdog will print a warning message to the system log.
Soft vs. Hard Lockups
Soft Lockup
A ‘softlockup’ is defined as a bug that causes the kernel to loop in kernel mode for more than 20 seconds, without giving other tasks a chance to run. The current stack trace is displayed upon detection and, by default, the system will stay locked up.
By default the system will display the stack trace and stay locked up. Watchdog can be configured to reboot the system automatically when a soft lockup is detected. This can be done by setting the softlockup_panic parameter to a value greater than zero.
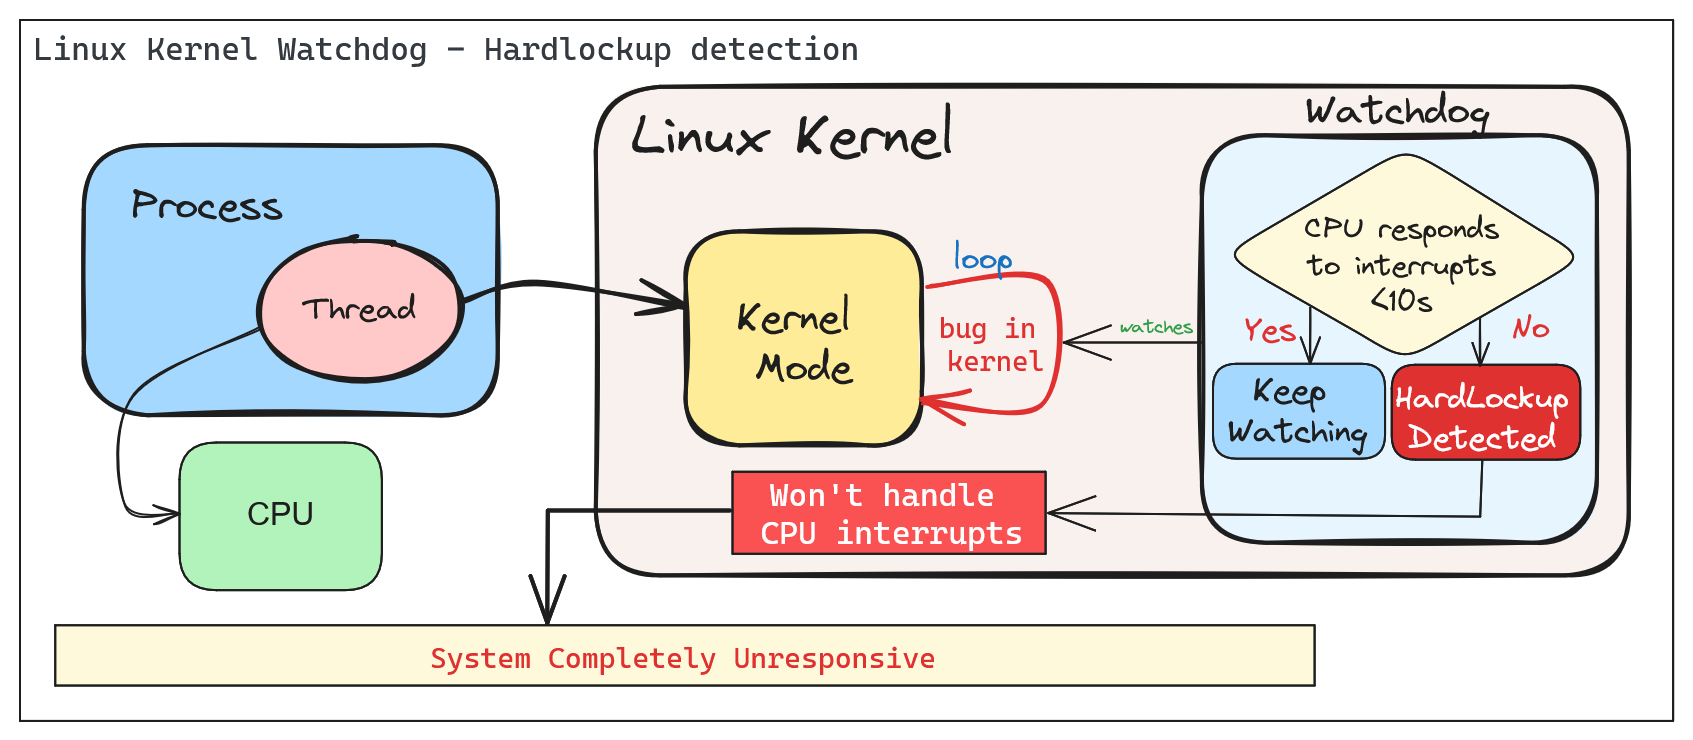
A ‘hardlockup’ is defined as a bug that causes the CPU to loop in kernel mode for more than 10 seconds, without letting other interrupts have a chance to run.
Similar to softlockup, the system will display the stack trace and stay locked up. The watchdog can be configured to reboot the system automatically when a hard lockup is detected. This can be done by setting the hardlockup_panic parameter to a value greater than zero.
Common error messages:
BUG: hard lockup - CPU#0 stuck for 22s! [swapper/0:1]Modules linked in: ...
Deep Dive into Soft/Hard Lockups
Reacting to soft/hard lockups
Ok, so you have a soft or hard lockup, what now? Here are some steps you can take to troubleshoot and resolve the issue:
The Basics
1. Check the system logs: Look for any error messages or warnings that may indicate the cause of the lockup.
2. Check the CPU load: High CPU load can cause lockups. Use tools like top or htop to monitor CPU usage.
3. Read the watchdog warning message: The watchdog will print a warning message to the system log when a lockup is detected. This message may provide clues as to the cause of the lockup. Usually, the message will include a stack trace that shows where the CPU is stuck, also the name of the process that caused the lockup and it’s PID.
Thresholds
The watchdog has default thresholds for detecting soft and hard lockups. These thresholds can be adjusted to suit your system’s needs.
Before changing thresholds, it is important to understand the implications of changing these values. Setting the thresholds too low may result in false positives, while setting them too high may result in missed lockups.
A periodic hrtimer runs to generate interrupts and kick the watchdog job. An NMI perf event is generated every “watchdog_thresh” (compile-time initialized to 10 and configurable through sysctl of the same name) seconds to check for hardlockups. If any CPU in the system does not receive any hrtimer interrupt during that time the ‘hardlockup detector’ (the handler for the NMI perf event) will generate a kernel warning or call panic, depending on the configuration.
The watchdog job runs in a stop scheduling thread that updates a timestamp every time it is scheduled. If that timestamp is not updated for 2*watchdog_thresh seconds (the softlockup threshold) the ‘softlockup detector’ (coded inside the hrtimer callback function) will dump useful debug information to the system log, after which it will call panic if it was instructed to do so or resume execution of other kernel code.
Check current threshold:
cat /proc/sys/kernel/watchdog_thresh
10
Update threshold to 30 seconds:
# For temporary changeecho30 > /proc/sys/kernel/watchdog_thresh
# For permanent changeecho"kernel.watchdog_thresh = 30" >> /etc/sysctl.conf
sysctl -p
Advanced Troubleshooting
The watchdog can be configured to panic the system when a lockup is detected. This can be done by setting the softlockup_panic or hardlockup_panic parameters to a value greater than zero.:
# Enable panic on soft lockupecho1 > /proc/sys/kernel/softlockup_panic
# Enable panic on hard lockupecho1 > /proc/sys/kernel/hardlockup_panic
In combination with crash dump, you can get a full dump of the system state when a lockup is detected. This can be useful for debugging the issue.
Step-by-step guide for this recipe:
1. Enable crash dump in the kernel configuration. Make sure that it’s collecting memory dumps when a kernel panic occurs.
2. Configure the kernel to reboot the system when a lockup is detected.
3. Proceed by analyzing the crash dump to identify the cause of the lockup.
Demo - Creating a Softlockup and understanding the watchdog output
Simulating a Soft Lockup
For the example below, we will simulate a soft lockup by loading a kernel module design to test if watchdog and lockup detection are working as expected.
Note: When installing Linux Kernel modules, make sure: You are using the correct version of the kernel module for your kernel version. (Browse kernel config source code and match your kernel version: Example for v6.9.5). And, that you have the necessary kernel headers installed.
The following parameters are available to simulate a variety of lockups:
# modinfo soft.kofilename: /root/CONFIG_TEST_LOCKUP/soft.ko
description: Test module to generate lockups
author: Konstantin Khlebnikov <[email protected]>
license: GPL
srcversion: 302B4AE69F898F7B25CABF8
depends:
retpoline: Y
name: soft
vermagic: 5.15.0-1064-azure SMP mod_unload modversions
parm: time_secs:lockup time in seconds, default 0(uint)parm: time_nsecs:nanoseconds part of lockup time, default 0(uint)parm: cooldown_secs:cooldown time between iterations in seconds, default 0(uint)parm: cooldown_nsecs:nanoseconds part of cooldown, default 0(uint)parm: iterations:lockup iterations, default 1(uint)parm: all_cpus:trigger lockup at all cpus at once (bool)parm: state:wait in 'R' running (default), 'D' uninterruptible, 'K' killable, 'S' interruptible state (charp)parm: use_hrtimer:use high-resolution timer for sleeping (bool)parm: iowait:account sleep time as iowait (bool)parm: lock_read:lock read-write locks forread(bool)parm: lock_single:acquire locks only at one cpu (bool)parm: reacquire_locks:release and reacquire locks/irq/preempt between iterations (bool)parm: touch_softlockup:touch soft-lockup watchdog between iterations (bool)parm: touch_hardlockup:touch hard-lockup watchdog between iterations (bool)parm: call_cond_resched:call cond_resched() between iterations (bool)parm: measure_lock_wait:measure lock waittime(bool)parm: lock_wait_threshold:print lock waittime longer than this in nanoseconds, default off (ulong)parm: disable_irq:disable interrupts: generate hard-lockups (bool)parm: disable_softirq:disable bottom-half irq handlers (bool)parm: disable_preempt:disable preemption: generate soft-lockups (bool)parm: lock_rcu:grab rcu_read_lock: generate rcu stalls (bool)parm: lock_mmap_sem:lock mm->mmap_lock: block procfs interfaces (bool)parm: lock_rwsem_ptr:lock rw_semaphore at address (ulong)parm: lock_mutex_ptr:lock mutex at address (ulong)parm: lock_spinlock_ptr:lock spinlock at address (ulong)parm: lock_rwlock_ptr:lock rwlock at address (ulong)parm: alloc_pages_nr:allocate and free pages under locks (uint)parm: alloc_pages_order:page order to allocate (uint)parm: alloc_pages_gfp:allocate pages with this gfp_mask, default GFP_KERNEL (uint)parm: alloc_pages_atomic:allocate pages with GFP_ATOMIC (bool)parm: reallocate_pages:free and allocate pages between iterations (bool)parm: file_path:file path to test(string)parm: lock_inode:lock file -> inode -> i_rwsem (bool)parm: lock_mapping:lock file -> mapping -> i_mmap_rwsem (bool)parm: lock_sb_umount:lock file -> sb -> s_umount (bool)
We will simulate a soft lockup by loading the module with the following parameters:
After loading the module, the system will be locked up for 35 seconds. The watchdog will detect the soft lockup and print a warning message to the system log.
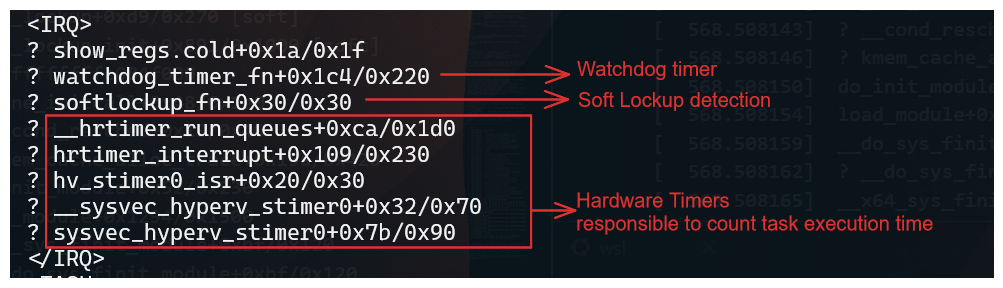
The stack trace shows where the CPU was stuck and provides information about the process that caused the lockup.
Important information from the stack trace:
IRQ - Indicates that the CPU was in an interrupt context when the lockup occurred.
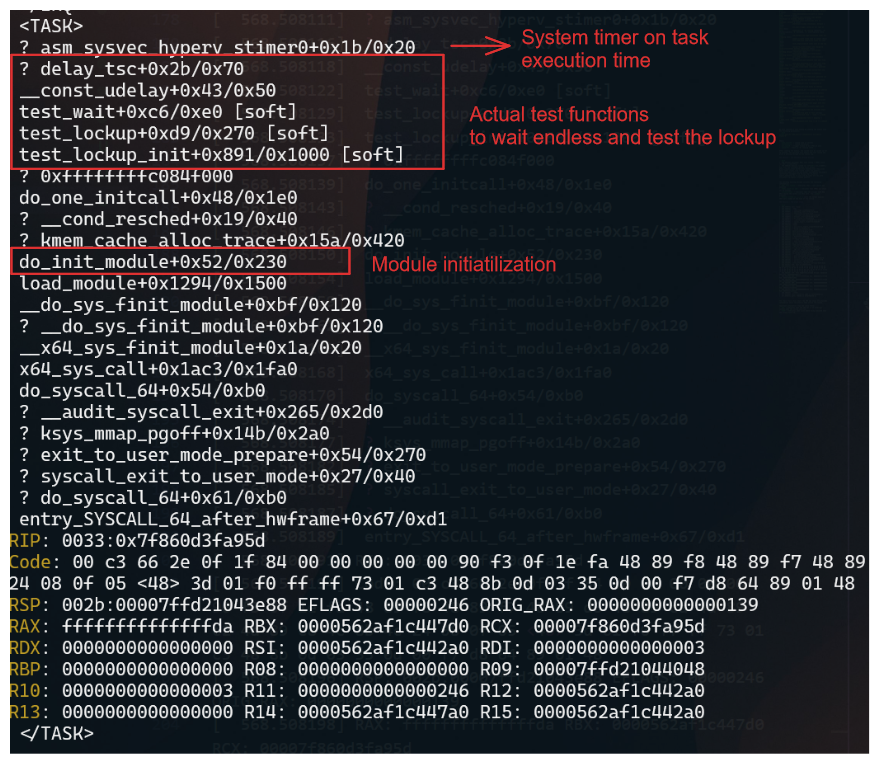
TASK - Indicates what calls where being executed when the lockup occurred.
When comparing with source code, you can identify the function that caused the lockup. In this case, the test_wait function in the soft module caused the lockup.
The test_wait function was waiting in the TASK_RUNNING state, which caused the CPU to be stuck in a loop.
Since we are loading a module, the execution will be in kernel mode, and the watchdog will detect the lockup.
The mdelay function was used to delay the execution of the function for a specified number of milliseconds. In this case, the function was delayed for 35 seconds, which caused the lockup.
Final Thoughts
The Linux Kernel Watchdog is a powerful tool for detecting soft and hard lockups. By understanding how the watchdog works and how to react to lockups, you can troubleshoot and resolve issues more effectively. Remember to check the system logs, CPU load, and watchdog warning messages when a lockup occurs. By following best practices and using advanced troubleshooting techniques, you can identify the root cause of lockups and take steps to prevent them in the future.
2 - Why Kernel Crash Dumps Are Critical for Root Cause Analysis
Deep-dive on using vmcore crash dumps for postmortem kernel debugging, including real-world kernel bug and OOM workflows.
Postmortem Kernel Forensics with vmcore
Summary
When the Linux kernel panics, there is no userspace stack, no application logs, and often no intact filesystems. The only canonical, lossless record of the kernel’s terminal state is the crash dump (vmcore). Without vmcore, you are constrained to heuristics and guesswork; with vmcore, you can deterministically reconstruct CPU state, task scheduling, memory allocators, locks, timers, and subsystems at the exact point of failure. This is the difference between timeline narratives and hard proof.
What a vmcore Captures (and Why It Matters)
CPU architectural state: general-purpose registers, control registers, MSRs, per-CPU contexts.
Full kernel virtual memory snapshot: page tables, slab caches, VFS dentries/inodes, networking stacks, block layer queues, and device driver state.
Task list and scheduler state: task_struct, runqueues, RT/DL classes, stop machine contexts.
Lock state: mutex, spinlock_t owners, wait queues, and contention points.
With unstripped vmlinux and kernel debuginfo, these structures become symbol-resolved and type-aware in tools like crash and gdb.
Minimal Prerequisites for a Useful Dump
Reserve crash kernel memory at boot: crashkernel=auto (or a fixed size appropriate to RAM and distro guidance).
Ensure kdump service is active and the dump target has write bandwidth and space (prefer raw disk/LVM or fast local FS; only use NFS/SSH if necessary).
Keep exact-matching debuginfo for the running kernel build:
Uncompressed vmlinux with full DWARF and symbols.
Matching System.map and all loaded module debuginfo (e.g., kernel-debuginfo, kernel-debuginfo-common on RHEL/Fedora; linux-image-…-dbgsym on Debian/Ubuntu repositories).
Persist critical panic policies:
sysctl -w kernel.panic_on_oops=1sysctl -w kernel.unknown_nmi_panic=1sysctl -w kernel.panic_on_unrecovered_nmi=1sysctl -w vm.panic_on_oom=2# 1=panic on OOM, 2=panic if no killable tasksysctl -w kernel.panic=10# auto-reboot N seconds after panic
Persist via /etc/sysctl.d/*.conf as needed. For manual testing, enable SysRq and force a controlled crash:
echo1| sudo tee /proc/sys/kernel/sysrq
echo c | sudo tee /proc/sysrq-trigger
Acquisition Pipeline and Size Reduction
makedumpfile can filter non-essential pages to reduce vmcore size and I/O time without destroying forensics value. Recommended options:
sys # kernel, uptime, panic infops # task list summarybt # backtrace of current task (set with 'set' or '-p PID')log # kernel ring buffer extracted from vmcorekmem -i # memory info: zones, nodes, reclaimersfiles -p <PID> # per-process file descriptorsdev -d # device list & driversirq # IRQ and softirq stateforeach bt # backtrace all tasks (can be heavy on large systems)
Example 1 — Kernel Bug/Oops Leading to Panic
Symptoms at runtime: abrupt reboot, serial console shows BUG/oops with taint flags; no userspace core dumps.
Postmortem workflow:
vmcore-dmesg /var/crash/vmcore | less
Look for signatures such as:
BUG: unable to handle kernel NULL pointer dereference at 0000000000000010
RIP: 0010:driver_xyz_process+0x5a/0x120 [driver_xyz]
Call Trace:
  worker_thread+0x8f/0x1a0
  kthread+0xef/0x120
  ret_from_fork+0x2c/0x40
Tainted: G    B  W  OE  5.14.0-xyz #1
Correlate symbols and inspect the faulting frame:
crash> sym driver_xyz_process
crash> dis -l driver_xyz_process+0x5a
crash> bt
crash> set -p <pid_of_worker>
crash> bt -f # show full frames with argumentscrash> struct task_struct <task_addr>
crash> ps
   PID    PPID  CPU       TASK        ST  %MEM     VSZ    RSS  COMM
> 4123       2    7  ffff8b2a7f1f0c00  RU   0.1   0      0    kworker/u16:2
   1         0    0  ffff8b2a70000180  IN   0.0  16272  1308  systemd
   532       1    2  ffff8b2a703f9b40  IN   0.2  912312 80324 containerd
   987     532    5  ffff8b2a7a2fcd00  IN   0.4  1452312 231212 kubelet
crash> bt
PID: 4123  TASK: ffff8b2a7f1f0c00  CPU: 7  COMMAND: "kworker/u16:2"
 #0 [ffffb2f1c2d2be78] machine_kexec at ffffffff914b3e10
 #1 [ffffb2f1c2d2bec8] __crash_kexec at ffffffff915a1c32
 #2 [ffffb2f1c2d2bf28] panic at ffffffff914c2a9d
 #3 [ffffb2f1c2d2bf80] oops_end at ffffffff9148df90
 #4 [ffffb2f1c2d2bfb0] page_fault_oops at ffffffff9148e4b5
 #5 [ffffb2f1c2d2bfe0] exc_page_fault at ffffffff91abc7e1
 #6 [ffffb2f1c2d2c018] asm_exc_page_fault at ffffffff91c0133e
 #7 [ffffb2f1c2d2c048] driver_xyz_process+0x5a/0x120 [driver_xyz]
 #8 [ffffb2f1c2d2c0a0] worker_thread+0x8f/0x1a0
 #9 [ffffb2f1c2d2c0e0] kthread+0xef/0x120
#10 [ffffb2f1c2d2c110] ret_from_fork+0x2c/0x40
crash> kmem -i
                 PAGES        TOTAL      PERCENTAGE
    TOTAL MEM    3276800      12.5 GB   100%
         FREE     152345       595 MB     4%
         USED    3124455      11.9 GB    96%
       SHARED      80312       313 MB     2%
      BUFFERS      49152       192 MB     1%
       CACHED     842304       3.2 GB    26%
        SLAB      921600       3.5 GB    28%
      PAGECACHE   655360       2.5 GB    20%
ZONE DMA32: min 16224, low 20280, high 24336, scanned 1e6, order 3 allocs failing
Reclaimers: kswapd0: active, direct reclaim: observed
crash> log | head -n 6
<0>[ 1234.567890] Kernel panic - not syncing: Fatal exception
<4>[ 1234.567900] CPU: 7 PID: 4123 Comm: kworker/u16:2 Tainted: G    B  W  OE
<4>[ 1234.567905] RIP: 0010:driver_xyz_process+0x5a/0x120 [driver_xyz]
<6>[ 1234.567950] Workqueue: events_unbound driver_xyz_wq
Actionable patterns:
Null-dereference at a deref site → check expected invariants and lifetime rules for the object; validate RCU usage (rcu_read_lock()/_unlock() pairs) and reference counting (kref, refcount_t).
Use-after-free → examine slab allocator metadata around the pointer; kmem and rd -p (raw reads) can validate freelist poisoning.
Interrupt vs thread context → verify hardirq/softirq context in bt; ensure lock acquisition order obeys documented lockdep dependencies.
If tainted by proprietary modules (OE), ensure matching module debuginfo is loaded so frames resolve cleanly. Validate module list:
crash> mod
From here, produce a minimal repro and map the faulting path to specific source lines using dis -l and DWARF line tables; attach exact register state and call trace to the fix.
Example 2 — Out-Of-Memory (OOM) and Panic-on-OOM
By default, OOM does not produce a vmcore because the kernel kills a task to free memory and continues. For deterministic forensics on pathological memory pressure, set vm.panic_on_oom=1 or 2 so the system panics and kdump captures a vmcore.
crash> kmem -i # zones, watermarks, reclaimers statecrash> kmem -s # slab usage; look for runaway cachescrash> ps -m # memory stats per taskcrash> vtop <task> <va> # translate VA to PFN to inspect mappingcrash> files -p <PID> # fd pressure and mmapscrash> p sysctl_oom_dump_tasks
crash> log # OOM killer selection rationale, constraints
Indicators:
oom-kill:constraint=CONSTRAINT_NONE,nodemask=(null),cpuset=... shows the policy path; score/oom_score_adj determine the victim.
Stalled reclaim (kswapd, direct reclaim) with high order allocations failing → likely hugepages, GFP_ATOMIC depletion, or CMA stress.
One slab consuming disproportionate memory → e.g., runaway dentry or kmalloc-64 due to leak; confirm with kmem -S and inspect suspects via object walkers if available.
If OOM was triggered by a specific container/cgroup, use cgroup-aware views (kernel dependent):
crash> p memory.stat @<memcg_addr>
Correlating vmcore with Source and Binaries
Always analyze with the exact build artifacts of the panicked kernel:
vmlinux and module .debug files must match the uname -r and build ID of the running kernel at the time of panic.
Mismatches lead to wrong type layouts, invalid offsets, and misleading backtraces.
On distros with split debuginfo, install the debuginfo packages for the precise NVR (Name-Version-Release) string.
3 - Enabling Automatic Kernel Crash Collection with kdump
How to automatically enable and configure kdump crash collection on Linux systems using the kdump-enabler script.
Automatic Enablement of Kernel Crash Dump Collection with kdump-enabler
This article explains how to automatically enable and configure kernel crash dump (kdump) collection on Linux systems using the kdump-enabler script. This approach works across multiple distributions and simplifies the process of preparing your system to collect crash dumps for troubleshooting and analysis.
Overview
kdump-enabler is a Bash script that automates the setup of kdump:
Installs required packages
Configures the crashkernel parameter in GRUB
Enables and starts the kdump service
Sets up SysRq for manual crash triggering
Creates backups of configuration files before changes
Supports Ubuntu, Debian, RHEL, CentOS, Fedora, openSUSE, Arch Linux, and more
Prerequisites
Root privileges (run with sudo)
systemd-based Linux distribution
GRUB bootloader
Sufficient disk space in /var/crash for crash dumps
Installation
Clone the repository and run the script:
git clone https://github.com/samatild/kdump-enabler.git
cd kdump-enabler
sudo ./kdump-enabler.sh
sudo ./kdump-enabler.sh --check-only
# Output (abridged):[INFO] Checking current kdump configuration...
[WARNING] No crashkernel parameter found in kernel command line
[WARNING] kdump service not found
[INFO] Crash dump directory: /var/crash (0 dumps found)# Exits after status check without installing or modifying anything
Skip SysRq enablement
sudo ./kdump-enabler.sh -y --no-sysrq
# Output differences:# - Does not enable SysRq or persist sysctl settings# - All other steps (packages, GRUB, service) proceed
4 - Kernel Mode vs User Mode: Privilege Levels and System Call Execution
Deep technical explanation of CPU privilege levels, kernel mode vs user mode execution contexts, system call mechanisms, memory protection, and security implications in the Linux kernel.
CPU Privilege Levels and Execution Contexts
Summary
Modern processors implement hardware-enforced privilege levels to isolate untrusted user code from critical kernel services. Linux uses two primary modes: kernel mode (ring 0, CPL 0, EL1) and user mode (ring 3, CPL 3, EL0). Kernel mode grants unrestricted access to CPU features, physical memory, I/O ports, and privileged instructions. User mode restricts access to a virtualized, isolated address space and requires kernel mediation for hardware resources. The transition between modes occurs via system calls, interrupts, and exceptions, all managed by the kernel’s interrupt and system call handlers. Understanding this separation is fundamental to security, performance optimization, and kernel debugging.
CPU Privilege Levels (Architecture Overview)
x86/x86-64 Privilege Rings
The x86 architecture defines four privilege levels (rings 0-3), though Linux uses only rings 0 and 3:
Access to kernel address space (typically 0xffff800000000000 and above on x86-64)
Can modify page tables, MMU configuration
2. Privileged Instructions
cli/sti (disable/enable interrupts)
lgdt/lidt (load GDT/IDT)
mov crX (control register access)
in/out (I/O port access)
hlt (halt CPU)
wrmsr/rdmsr (Model-Specific Registers)
3. Interrupt and Exception Handling
Can install interrupt handlers
Access to interrupt controller (APIC, GIC)
Exception vector table modification
4. System Control
CPU scheduling decisions
Process creation/destruction
File system operations
Network stack management
Kernel example - Direct memory access:
// Kernel can directly access physical memory
void*phys_addr=__va(0x1000000);// Convert physical to virtual
unsignedlongvalue=*(unsignedlong*)phys_addr;// User mode cannot do this - would cause segmentation fault
Kernel Mode Execution Contexts
1. Process Context
Executing on behalf of a user process (system call handler)
Has associated task_struct, user-space memory mappings
Can sleep, be preempted
Example: read(), write(), open() syscall handlers
2. Interrupt Context
Executing in response to hardware interrupt
No associated process (current may point to interrupted process)
// arch/x86/kernel/entry_64.S
ENTRY(entry_SYSCALL_64)// Save user context
SWAPGSmovq%rsp,PER_CPU_VAR(cpu_current_top_of_stack)// Switch to kernel stack
movqPER_CPU_VAR(cpu_current_top_of_stack),%rsp// Now in kernel mode, process context
calldo_syscall_64
User Mode Characteristics
Restrictions and Isolation
1. Virtual Memory Only
Cannot access physical addresses directly
Limited to virtual address space (typically 0x0000000000000000 to 0x00007fffffffffff on x86-64)
Page tables managed by kernel, not user-space
Segmentation fault on invalid access
2. No Privileged Instructions
Attempting privileged instructions causes General Protection Fault (#GP)
Trapped by kernel, typically results in SIGSEGV to process
3. System Call Interface
Must use system calls to request kernel services
System calls are the controlled entry point to kernel mode
Each syscall has defined parameters and return values
4. Process Isolation
Each process has independent virtual address space
Cannot directly access other processes’ memory
Inter-process communication requires kernel mediation (shared memory, pipes, sockets)
User-space example - Attempting privileged operation:
// This will fail in user mode
intmain(){unsignedlongcr0;asmvolatile("mov %%cr0, %0":"=r"(cr0));// Privileged instruction
// Result: SIGSEGV - Segmentation fault
return0;}
User-space example - Valid system call:
// User mode must use system calls
intmain(){intfd=open("/etc/passwd",O_RDONLY);// System call
if(fd<0){perror("open");return1;}close(fd);// System call
return0;}
Mode Transitions: System Calls
System Call Mechanism
System calls are the controlled mechanism for transitioning from user mode to kernel mode. The transition involves:
User-space preparation: Set up syscall number and arguments
Hardware trap: CPU switches to kernel mode via special instruction
Kernel handler: Kernel validates and executes requested operation
Return: Kernel switches back to user mode with result
x86-64 System Call Interface
Transition from User Mode to Kernel Mode via System Call (Click to expand)
Syscall instruction (syscall):
Fastest method on x86-64
System call number in %rax
Arguments in %rdi, %rsi, %rdx, %r10, %r8, %r9
Return value in %rax
Return address in %rcx
Kernel source:arch/x86/entry/entry_64.S
// User-space syscall invocation (glibc wrapper)
staticinlinelong__syscall0(longn){longret;asmvolatile("syscall":"=a"(ret):"a"(n):"rcx","r11","memory");returnret;}// Kernel entry point
ENTRY(entry_SYSCALL_64)UNWIND_HINT_EMPTY// Swap GS to kernel space
swapgs// Save user-space registers
movq%rsp,PER_CPU_VAR(cpu_current_top_of_stack)// Load kernel stack
movqPER_CPU_VAR(cpu_current_top_of_stack),%rsp// Call C handler
calldo_syscall_64
// Simplified syscall handler
__visiblenoinstrvoiddo_syscall_64(structpt_regs*regs,intnr){// Validate syscall number
if(likely(nr<NR_syscalls)){// Get syscall function pointer
syscall_fn_tsyscall_fn=syscall_table[nr];// Execute syscall (still in kernel mode)
regs->ax=syscall_fn(regs);}else{regs->ax=-ENOSYS;}// Return to user mode
syscall_exit_to_user_mode(regs);}
Practical example - Tracing system calls:
# Trace all syscalls made by a processstrace -e trace=all ls -l
# Example output:# openat(AT_FDCWD, "/etc/ld.so.cache", O_RDONLY|O_CLOEXEC) = 3# read(3, "\177ELF\2\1\1\3\0\0\0\0\0\0\0\0\3\0>\0\1\0\0\0\360\3\2\0\0\0\0\0"..., 832) = 832# close(3) = 0# openat(AT_FDCWD, ".", O_RDONLY|O_NONBLOCK|O_CLOEXEC|O_DIRECTORY) = 3# getdents64(3, /* 5 entries */, 32768) = 144# close(3) = 0
CPU saves user context (registers, return address)
Kernel interrupt handler executes
Kernel returns to user mode (or schedules different task)
Kernel source:arch/x86/entry/entry_64.S
// Interrupt entry point
ENTRY(common_interrupt)// Save all registers
SAVE_ALL// Disable interrupts (if needed)
cli// Call C interrupt handler
calldo_IRQ// Restore and return
RESTORE_ALLiretq
Exception Types
Faults (correctable):
Page fault (#PF): Virtual memory access violation
General Protection Fault (#GP): Invalid memory access, privilege violation
# Install perf toolssudo apt-get install linux-perf
# Trace syscalls with timingsudo perf trace -e syscalls:sys_enter_openat,syscalls:sys_exit_openat ls
# Output shows:# 0.000 openat(AT_FDCWD, "/etc/ld.so.cache", O_RDONLY|O_CLOEXEC) = 3# 0.012 <... openat resumed> ) = 3# Each line shows user->kernel->user transition
Example 2: Kernel vs User Memory Access
User-space program:
#include<stdio.h>#include<unistd.h>#include<sys/mman.h>intmain(){// User-space memory allocation
void*user_addr=mmap(NULL,4096,PROT_READ|PROT_WRITE,MAP_PRIVATE|MAP_ANONYMOUS,-1,0);printf("User-space address: %p\n",user_addr);*(int*)user_addr=42;// OK - user can write to own memory
// Attempt kernel-space access
void*kernel_addr=(void*)0xffffffff80000000;// *(int *)kernel_addr = 42; // Would cause SIGSEGV
return0;}
Kernel module (for comparison):
// Kernel module can access both
staticint__inittest_init(void){void*user_addr=(void*)0x400000;// User-space address
void*kernel_addr=(void*)0xffffffff80000000;// Kernel address
// Access kernel memory (requires proper mapping)
// unsigned long val = *(unsigned long *)kernel_addr;
// Access user memory (requires copy_from_user)
// unsigned long val;
// copy_from_user(&val, user_addr, sizeof(val));
return0;}
Example 3: System Call Overhead
Measure syscall overhead:
#include<stdio.h>#include<sys/time.h>#include<unistd.h>intmain(){structtimevalstart,end;longiterations=1000000;gettimeofday(&start,NULL);for(longi=0;i<iterations;i++){getpid();// System call
}gettimeofday(&end,NULL);longus=(end.tv_sec-start.tv_sec)*1000000+(end.tv_usec-start.tv_usec);printf("Average syscall time: %.2f nanoseconds\n",(us*1000.0)/iterations);return0;}// Typical output: ~200-500 nanoseconds per syscall
// This includes: user->kernel transition + handler + kernel->user return
Example 4: Inspecting Current Mode
Check if code is running in kernel or user mode:
# From user-space (always shows user mode)cat /proc/self/status | grep State
# From kernel module (can check current mode)# In kernel code:if(user_mode(regs)){ printk("Running in user mode\n");}else{ printk("Running in kernel mode\n");}
Kernel Internals: Mode Switching Code
Context Switch and Mode Return
Returning to user mode after syscall:
// arch/x86/entry/common.c
__visiblenoinstrvoidsyscall_exit_to_user_mode(structpt_regs*regs){// Check for pending work (signals, preemption)
exit_to_user_mode_prepare(regs);// Restore user-space registers
__syscall_exit_to_user_mode_work(regs);}static__always_inlinevoid__syscall_exit_to_user_mode_work(structpt_regs*regs){// Restore GS (swap back to user GS)
swapgs;// Return to user mode
// IRET instruction restores:
// - CS (code segment) -> CPL=3
// - SS (stack segment)
// - RFLAGS (flags register)
// - RIP (instruction pointer)
// - RSP (stack pointer)
}
Interrupt Return
Returning from interrupt handler:
// arch/x86/entry/entry_64.S
ENTRY(common_interrupt_return)// Check if returning to user mode
testb$3,CS(%rsp)jnzswapgs_restore_regs_and_return_to_usermode// Returning to kernel mode
RESTORE_ALLiretqswapgs_restore_regs_and_return_to_usermode:// Swap GS back to user mode
swapgsRESTORE_ALLiretq
Performance Considerations
System Call Overhead
Factors affecting syscall performance:
Mode transition cost: ~50-100 CPU cycles
Register save/restore: ~100-200 cycles
Cache effects: TLB flushes, cache misses
Handler execution: Varies by syscall (nanoseconds to microseconds)
Optimization techniques:
vDSO (Virtual Dynamic Shared Object): Some syscalls (e.g., gettimeofday()) execute in user-space
Avoid unnecessary syscalls: Cache results, use memory-mapped I/O
Reducing Mode Transitions
Example - Reducing gettimeofday() overhead:
// Traditional approach (syscall each time)
for(inti=0;i<1000;i++){gettimeofday(&tv,NULL);// 1000 syscalls
}// Optimized approach (vDSO - no syscall)
#include<sys/time.h>#include<time.h>for(inti=0;i<1000;i++){clock_gettime(CLOCK_REALTIME,&ts);// May use vDSO, no syscall
}
Debugging and Inspection Tools
Identifying Mode Transitions
1. Using strace:
# Trace all syscalls (shows user->kernel transitions)strace -c ls -l
# Output:# % time seconds usecs/call calls errors syscall# ------ ----------- ----------- --------- --------- ----------------# 23.45 0.000234 234 1000 openat# 15.23 0.000152 152 1000 read# 10.12 0.000101 101 1000 close
# Attach to running kernel (requires kgdb)(gdb) target remote /dev/ttyS0
(gdb)break do_syscall_64
(gdb)continue# Breakpoint shows entry to kernel mode
Kernel Logging
Monitor mode transitions in kernel logs:
# Enable kernel debuggingecho8 > /proc/sys/kernel/printk # Enable all log levels# Watch for syscall-related messagesdmesg -w | grep -i "syscall\|fault\|segfault"
Common Pitfalls and Misconceptions
Misconception 1: “Kernel mode is always faster”
Reality: Mode transitions have overhead. Kernel mode itself isn’t faster; it’s necessary for privileged operations. User-space code can be faster for pure computation.
Misconception 2: “System calls are expensive”
Reality: Modern CPUs optimize syscall transitions. Overhead is typically 200-500 nanoseconds, negligible for most applications. I/O operations (disk, network) dominate latency, not syscall overhead.
Misconception 3: “Kernel code always runs in kernel mode”
Reality: Kernel code executes in kernel mode, but kernel threads can be scheduled like user processes. Interrupt handlers run in interrupt context, not process context.
Reality: User-space can access kernel memory through /proc, /sys, and mmap() of kernel-exported memory (e.g., /dev/mem with proper permissions). The kernel controls what is exposed.
References and Further Reading
Intel 64 and IA-32 Architectures Software Developer’s Manual: Volume 3A (System Programming Guide) - Privilege levels and protection
ARM Architecture Reference Manual: Exception levels and privilege model
Linux Kernel Source: arch/x86/entry/ (system call and interrupt entry code)
Understanding the Linux Kernel (3rd ed.): Chapter 1 (Introduction), Chapter 3 (Processes)
Linux Device Drivers (3rd ed.): Chapter 9 (Interrupt Handling)
man 2 syscalls: System call documentation
man 2 syscall: Generic system call wrapper
Note: The distinction between kernel mode and user mode is fundamental to operating system security and stability. All privileged operations must occur in kernel mode, while user applications run in isolated user mode with controlled access to system resources via system calls.
5 - Understanding CPU Statistics in Linux (/proc/stat)
Deep technical dive into CPU time accounting in Linux, covering user, nice, system, idle, iowait, irq, softirq, steal, guest, and guest_nice statistics with practical examples and kernel internals.
Kernel-Level CPU Time Accounting
Summary
The Linux kernel maintains precise, per-CPU time accounting across ten distinct execution contexts. These statistics, exposed via /proc/stat, represent cumulative jiffy counters (typically 1/100th or 1/1000th of a second) since system boot. Understanding these counters is essential for performance analysis, capacity planning, and diagnosing CPU contention, I/O bottlenecks, interrupt storms, and virtualization overhead.
The /proc/stat Interface
/proc/stat is a virtual file provided by the kernel’s proc filesystem. It contains system-wide statistics aggregated across all CPUs and individual per-CPU lines. The format is non-blocking and updated atomically by the kernel scheduler’s tick handler.
The first line (cpu) aggregates all CPUs; subsequent cpuN lines show per-CPU statistics. Each CPU line contains ten fields:
cpuX user nice system idle iowait irq softirq steal guest guest_nice
Note: All values are cumulative counters measured in jiffies (kernel ticks). To calculate percentages or rates, you must sample at two points in time and compute deltas.
Field-by-Field Breakdown
1. user (usr)
Kernel context: Time spent executing user-space code in normal priority processes.
Increment condition: Kernel tick handler (account_process_tick()) counts time when a process is running in user mode with default priority (nice value 0-0).
High system time indicates frequent syscalls or kernel processing
Typical range: 5-30% on normal systems
Spikes suggest I/O-bound workloads, context switching, or kernel-intensive operations
50% may indicate kernel bottlenecks or driver issues
Practical example:
# Monitor system call rate (indirectly via system time)T1=$(grep '^cpu ' /proc/stat | awk '{print $4}')strace -c -e trace=all sleep 1 2>&1| tail -1
T2=$(grep '^cpu ' /proc/stat | awk '{print $4}')echo"System time delta: $((T2 - T1)) jiffies"# High system time scenarios:# 1. Frequent file I/Odd if=/dev/urandom of=/tmp/test bs=4K count=10000# 2. Network operationscurl -s https://example.com > /dev/null
# 3. Process creationfor i in {1..1000};do true;done
Kernel code path:
// System time accounting during syscall
longsys_xyz(...){// Pre-syscall timestamp
account_system_time(current,cputime_before);// ... kernel work ...
account_system_time(current,cputime_after);}
4. idle
Kernel context: Time the CPU spent idle (no runnable tasks, waiting in idle loop).
Increment condition: Kernel idle loop (do_idle()) executes when the runqueue is empty. The idle task (PID 0, swapper) runs and increments this counter.
Kernel source:kernel/sched/idle.c::do_idle()
Example interpretation:
High idle = low CPU utilization
Idle time should decrease under load
100% - idle% ≈ total CPU utilization
On SMP systems, one CPU can be idle while others are busy
Kernel context: Time “stolen” by the hypervisor from a virtual CPU (only in virtualized environments).
Increment condition: Hypervisor preempts the guest VM’s virtual CPU to schedule other VMs or host tasks. The guest kernel detects this via paravirtualized time sources (e.g., KVM’s kvm_steal_time).
// Host side (KVM)
staticvoidrecord_steal_time(structkvm_vcpu*vcpu){structkvm_steal_time*st=vcpu->arch.st;st->steal+=current->sched_info.run_delay;}// Guest side (Linux kernel)
staticvoidkvm_steal_time_setup(void){// Read steal time from shared page
steal=st->steal;account_steal_time(steal);}
9. guest
Kernel context: Time spent running a guest OS (nested virtualization or KVM guest time accounting).
Increment condition: Host kernel accounts time when a guest VM’s virtual CPU is executing. This is the inverse of steal from the host’s perspective.
In nested virtualization, a guest VM can itself host VMs
Typically only relevant for hypervisor monitoring
Practical example:
# On a KVM host, monitor guest timewatch -n 1"grep '^cpu ' /proc/stat | awk '{print \"guest: \" \$10}'"# Compare with VM CPU usage (from host perspective)virsh domstats --cpu <domain>
Guest time accounting:
// When guest VM executes on host CPU
voidaccount_guest_time(structtask_struct*p,u64cputime){account_cputime_guest(p,cputime);// Guest time is also counted as user time from host perspective
account_user_time(p,cputime);}
10. guest_nice
Kernel context: Time spent running niced guest OS processes (nested virtualization).
Increment condition: Same as guest, but for processes with non-zero nice values in the guest.
Kernel source:kernel/sched/cputime.c::account_guest_time() with nice check
Kernel Source:kernel/sched/cputime.c (CPU time accounting implementation)
man proc(5):/proc/stat format documentation
Linux Performance and Tuning Guide: CPU accounting and analysis
Understanding the Linux Kernel (3rd ed.): Chapter 4 (Interrupts and Exceptions), Chapter 7 (Kernel Synchronization)
Note: All statistics are cumulative since boot. To calculate rates or percentages, always sample at two points in time and compute deltas. The kernel tick rate (HZ) determines counter resolution and can be queried via getconf CLK_TCK.