Understanding IO Delays in Linux - Performance Testing with io-delayer
Simulate and analyze IO performance degradation at multiple kernel layers to understand system bottlenecks.
Why IO Delays Matter in System Performance
Input/Output operations form the backbone of system performance, yet they represent one of the most complex and often misunderstood aspects of Linux performance engineering. When applications experience slowdowns, the root cause frequently traces back to IO delays introduced at various kernel layers.
The io-delayer kernel module provides a controlled environment to study these delays, helping engineers understand how different types of IO interception impact overall system performance.
The io-delayer Tool
io-delayer is a Linux kernel module that demonstrates IO performance degradation by intercepting operations at two critical kernel layers:
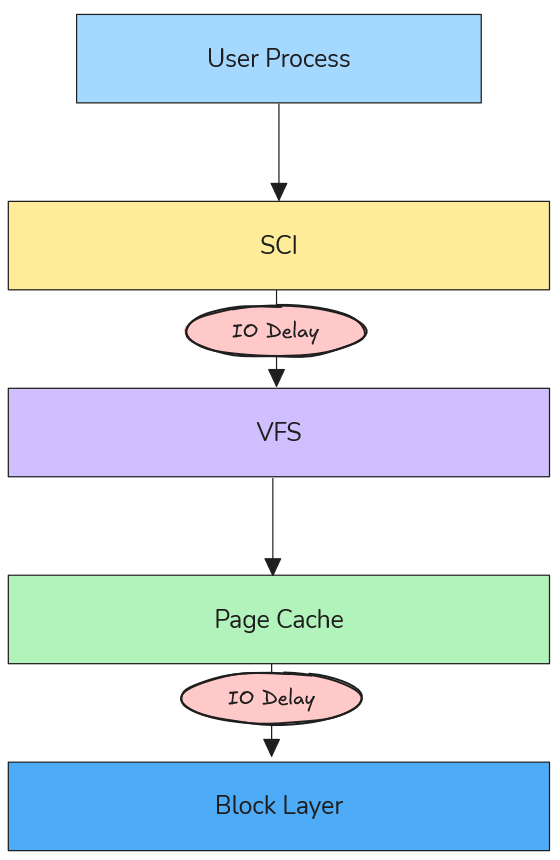
- VFS (Virtual File System) Layer: Where path resolution and high-level file operations occur
- Block Device Layer: Where actual storage device interactions happen
Using kprobes, the module inserts configurable microsecond delays into the IO path, allowing precise measurement of performance impact across different scenarios.
VFS Layer Delays: The Path Resolution Bottleneck
Understanding VFS in the IO Stack
The Virtual File System layer sits between system calls and actual filesystem implementations. When an application calls open(), read(), or write(), these requests pass through VFS before reaching storage devices.
According to the Linux kernel VFS documentation, VFS provides a unified interface that abstracts different filesystem types while handling core operations like:
- Path name resolution (translating
/home/user/file.txtto inode references) - Permission checking
- File descriptor management
- Caching coordination
How VFS Delays Degrade Performance
VFS delays primarily impact path resolution times, which become critical in scenarios involving:
1. Directory Traversal Operations
// Every path component requires VFS resolution
int fd = open("/home/user/documents/large-dataset/file-001.dat", O_RDONLY);
Each directory in the path (home, user, documents, large-dataset) triggers VFS operations. A 100μs delay per VFS call on a deep path like /var/lib/docker/containers/... can accumulate to milliseconds.
2. Metadata-Heavy Workloads
Applications that perform many stat() calls or directory listings suffer disproportionately:
- Package managers during dependency resolution
- File browsers indexing directories
- Backup tools scanning filesystem trees
3. Process Startup Overhead
Binary execution involves resolving library paths through VFS:
# Dynamic linker resolves ~50-100 library paths per process start
execve("/usr/bin/python3", ...)
Real-World VFS Delay Scenarios
Antivirus Software Impact: Modern endpoint protection often hooks VFS operations to scan files during access. A 50-200μs delay per file operation can make boot times 2-3x slower.
Container Filesystem Overhead: Docker’s layered filesystem adds VFS traversal through multiple overlay layers. Additional delays here compound with existing virtualization overhead.
Network Filesystem Latency: NFS and CIFS clients already introduce network round-trips; VFS delays can make interactive applications feel unresponsive.
Block Device Layer Delays: Queue Congestion Dynamics
Block Device Architecture
Below VFS lies the block device layer, responsible for managing IO queues, scheduling, and hardware interaction. The Linux block IO subsystem uses:
- IO Schedulers: CFQ, deadline, noop, mq-deadline
- Request Queues: Buffering and reordering IO requests
- Elevator Algorithms: Optimizing disk head movement patterns
Queue Congestion Mechanics
Block device delays create queue congestion that affects the entire storage subsystem:
1. Request Queue Backlog
// Block device delays cause queue depth to increase
// Normal queue depth: 1-32 requests
// With delays: Can exceed 1000+ pending requests
When delays are introduced at the block layer, incoming requests accumulate faster than they can be processed, leading to:
- Memory Pressure: IO requests consume kernel memory
- Increased Latency: Requests wait longer in queue
- Throughput Degradation: Device saturation occurs at lower loads
2. IO Scheduler Inefficiency
Modern IO schedulers optimize for:
- Seek Time Minimization: Grouping nearby requests
- Fairness: Preventing starvation between processes
- Priority Handling: Real-time vs. normal priority requests
Delays disrupt these optimizations, causing schedulers to make suboptimal decisions.
3. Cascading Effects
Block delays create feedback loops:
- Delays increase queue depth
- Deeper queues increase average wait time
- Higher latency causes applications to issue more concurrent requests
- More concurrency deepens queues further
Real-World Block Device Scenarios
Storage Security Appliances: Enterprise storage systems with inline deduplication, compression, or encryption add block-level delays. Understanding these helps size hardware appropriately.
Virtualization Storage Stacks: Hypervisor storage filters, vSAN layers, and distributed storage introduce block delays that compound with virtualization overhead.
Hardware RAID Controllers: Battery-backed write caches and consistency checks add measurable delays that affect application performance expectations.
Engineering Methodology: Testing with io-delayer
Installation and Setup
# Clone the repository
git clone https://github.com/samatild/io-delayer.git
cd io-delayer

# Build and install (requires kernel headers)
make all
sudo make install
sudo make load
VFS Delay Testing
# Set 100 microsecond VFS delay
sudo ./io-delayer-cli set 100

# Test path resolution impact
time find /usr -name "*.so" 2>/dev/null | head -10

# Measure application startup time
time python3 -c "import sys; print('Python started')"
Block Device Delay Testing
# Set 500 microsecond block device delay
sudo ./io-delayer-cli set-blk 500

# Test sequential throughput
dd if=/dev/zero of=/tmp/test bs=1M count=100

# Test random IO performance
fio --name=randread --rw=randread --bs=4k --size=1G --numjobs=4 --runtime=30
Performance Analysis Techniques
1. SystemTap/BPF Tracing
# Trace VFS operations with delays
stap -e '
probe vfs.read.return {
  if (execname() == "target_app") {
    printf("%s: VFS read latency %d us\n", execname(), gettimeofday_us() - @entry(gettimeofday_us()));
  }
}
'
2. IO Queue Monitoring
# Monitor block device queue depths
iostat -x 1

# Check /proc/diskstats for queue congestion
cat /proc/diskstats | grep sda
3. Flame Graph Analysis
# Generate IO flame graphs during testing
perf record -F 99 -a -g -- sleep 30
perf script | stackcollapse-perf.pl | flamegraph.pl > io-flame.svg
Real-World Engineering Applications
Security Software Performance Characterization
Understanding VFS delays helps security teams balance protection with performance:
# Simulate antivirus overhead
sudo ./io-delayer-cli set 150  # 150μs per file operation

# Test impact on common workflows
time grep -r "pattern" /var/log/  # Log analysis
time find /home -name "*.pdf"     # Document indexing
Key Insight: 100-200μs VFS delays can make interactive applications feel “sluggish,” explaining user complaints about security software impact.
Storage System Capacity Planning
Block device delays help size storage arrays:
# Simulate storage appliance latency
sudo ./io-delayer-cli set-blk 2000  # 2ms storage latency

# Test application tolerance
fio --name=oltp_simulation --rw=randrw --rwmixread=70 --bs=8k --size=10G --numjobs=8 --runtime=300
Key Insight: Applications tolerant of 1-2ms latency can handle most enterprise storage, but 5+ms delays require architectural changes.
Container Performance Optimization
Docker and Kubernetes environments add multiple IO layers:
# Simulate container filesystem overhead
sudo ./io-delayer-cli set 50   # OverlayFS traversal
sudo ./io-delayer-cli set-blk 100  # Storage driver delays

# Test container startup time
time docker run --rm hello-world
Key Insight: Container startup times degrade linearly with VFS delays, explaining performance differences between bare metal and containerized deployments.
Kernel Implementation Details
Kprobe Integration
The module uses kprobes to intercept kernel functions without modification:
// VFS layer hooking
static struct kprobe kp_vfs_read = {
    .symbol_name = "vfs_read",
    .pre_handler = pre_handler_vfs_read,
};

// Block device layer hooking
static struct kprobe kp_blk_start_request = {
    .symbol_name = "blk_start_request",
    .pre_handler = pre_handler_blk_start_request,
};
Delay Injection Mechanism
static void inject_delay(unsigned int delay_us)
{
    if (delay_us > 0) {
        udelay(delay_us);
    }
}
This uses udelay() for microsecond-precision delays, calibrated against the system timer.
Sysfs Interface
Runtime configuration via sysfs:
# VFS delay control
/sys/kernel/io_delayer/vfs_delay_us
# Block device delay control
/sys/kernel/io_delayer/blk_delay_us
Performance Benchmarking Best Practices
Controlled Testing Environment
- Baseline Measurement: Always establish performance without delays first
- Incremental Testing: Start with small delays (10-50μs) and increase gradually
- Statistical Analysis: Run tests multiple times, use percentiles over averages
- System Monitoring: Track CPU usage, memory pressure, and IO queue depths
Realistic Delay Values
Based on real-world measurements:
- VFS delays: 10-200μs (antivirus, DLP software)
- Block delays: 100-2000μs (storage appliances, encryption)
- Network delays: 50-500μs (WAN acceleration, proxy servers)
Performance Metrics to Monitor
# System-level metrics
vmstat 1
iostat -x 1
sar -u 1

# Application-level timing
strace -c -p $(pidof target_app)
perf stat -p $(pidof target_app)
Troubleshooting and Validation
Verifying Module Operation
# Check module loading
lsmod | grep io_delayer

# Verify kprobe attachment
cat /sys/kernel/debug/kprobes/list | grep io_delayer

# Monitor delay settings
cat /sys/kernel/io_delayer/vfs_delay_us
cat /sys/kernel/io_delayer/blk_delay_us
Performance Impact Assessment
# Before delays (baseline)
sudo ./io-delayer-cli set 0
sudo ./io-delayer-cli set-blk 0
fio --name=baseline --rw=randread --bs=4k --size=1G --runtime=30 --output=baseline.json

# With VFS delays
sudo ./io-delayer-cli set 100
fio --name=vfs_delayed --rw=randread --bs=4k --size=1G --runtime=30 --output=vfs_delayed.json

# With block device delays
sudo ./io-delayer-cli set 0
sudo ./io-delayer-cli set-blk 500
fio --name=blk_delayed --rw=randread --bs=4k --size=1G --runtime=30 --output=blk_delayed.json

# Calculate degradation - compare IOPS, latency percentiles, CPU usage
Security and Production Considerations
Important: This module is for testing purposes only. Production use can cause system instability or data loss.
- Requires root privileges for installation
- Can impact system responsiveness during high-delay testing
- Not intended for security enforcement (unlike actual antivirus software)
- MIT licensed for educational and research use
Advanced Use Cases
Custom Kernel Instrumentation
The module serves as a template for building custom IO tracing tools:
// Add custom probes for specific filesystems
static struct kprobe kp_ext4_writepages = {
    .symbol_name = "ext4_writepages",
    .pre_handler = custom_ext4_handler,
};
Performance Regression Testing
# Automated testing script
#!/bin/bash
for delay in 0 50 100 200; do
    sudo ./io-delayer-cli set $delay
    sudo ./io-delayer-cli set-blk $delay

    # Run your favorite benchmark utility (fio, tuxtoaster, etc.)
    echo "Testing with ${delay}us delays..."
    fio --name=regression_test --rw=randrw --rwmixread=70 --bs=4k --size=1G --runtime=30 --output=results_${delay}us.json

    # Or use tuxtoaster for comprehensive system testing
    # tuxtoaster --category disk --test "Random IOPS R/W"

    # Reset delays between tests
    sudo ./io-delayer-cli set 0
    sudo ./io-delayer-cli set-blk 0
    sleep 5
done
Conclusion
The io-delayer kernel module provides essential visibility into how IO delays at different kernel layers impact overall system performance. By understanding VFS path resolution bottlenecks and block device queue congestion, engineers can make informed decisions about:
- Security software deployment strategies
- Storage system architecture choices
- Container performance optimization
- Application performance expectations
The tool bridges the gap between theoretical kernel knowledge and practical performance engineering, enabling data-driven decisions in complex Linux environments.
Key Takeaways:
- VFS delays primarily affect interactive performance through path resolution overhead
- Block device delays create queue congestion that impacts throughput and scalability
- Real-world delays range from microseconds (software) to milliseconds (hardware)
- Systematic testing with tools like
io-delayerprevents performance surprises
Learn More & References
- Project Repository:
github.com/samatild/io-delayer - Linux VFS Documentation:
kernel.org/doc/html/latest/filesystems/vfs.html - Block IO Subsystem:
kernel.org/doc/html/latest/block/index.html - Kprobes Documentation:
kernel.org/doc/html/latest/trace/kprobes.html
Feedback
Was this page helpful?
Glad to hear it! Please tell us how we can improve.
Sorry to hear that. Please tell us how we can improve.