How to Troubleshoot Linux Performance — Field Playbook
A field-ready reference for Linux performance investigations — keep it open in a second terminal.
How to use this playbook
Linux performance problems split cleanly into two very different investigations, and picking the wrong one wastes hours:
| Situation | Track | What you do |
|---|---|---|
| The problem is happening right now (or you can reproduce it on demand) | Track A — Live Triage | Interactive tools, sample at 1s intervals, follow the bottleneck |
| The problem is intermittent / random (happens overnight, once a week, only under load you can’t reproduce) | Track B — Background Collection | Arm continuous loggers before the next occurrence, then mine the logs afterwards |
top. Stop, deploy collectors, walk away, and analyse later. Otherwise you’ll miss the event every single time.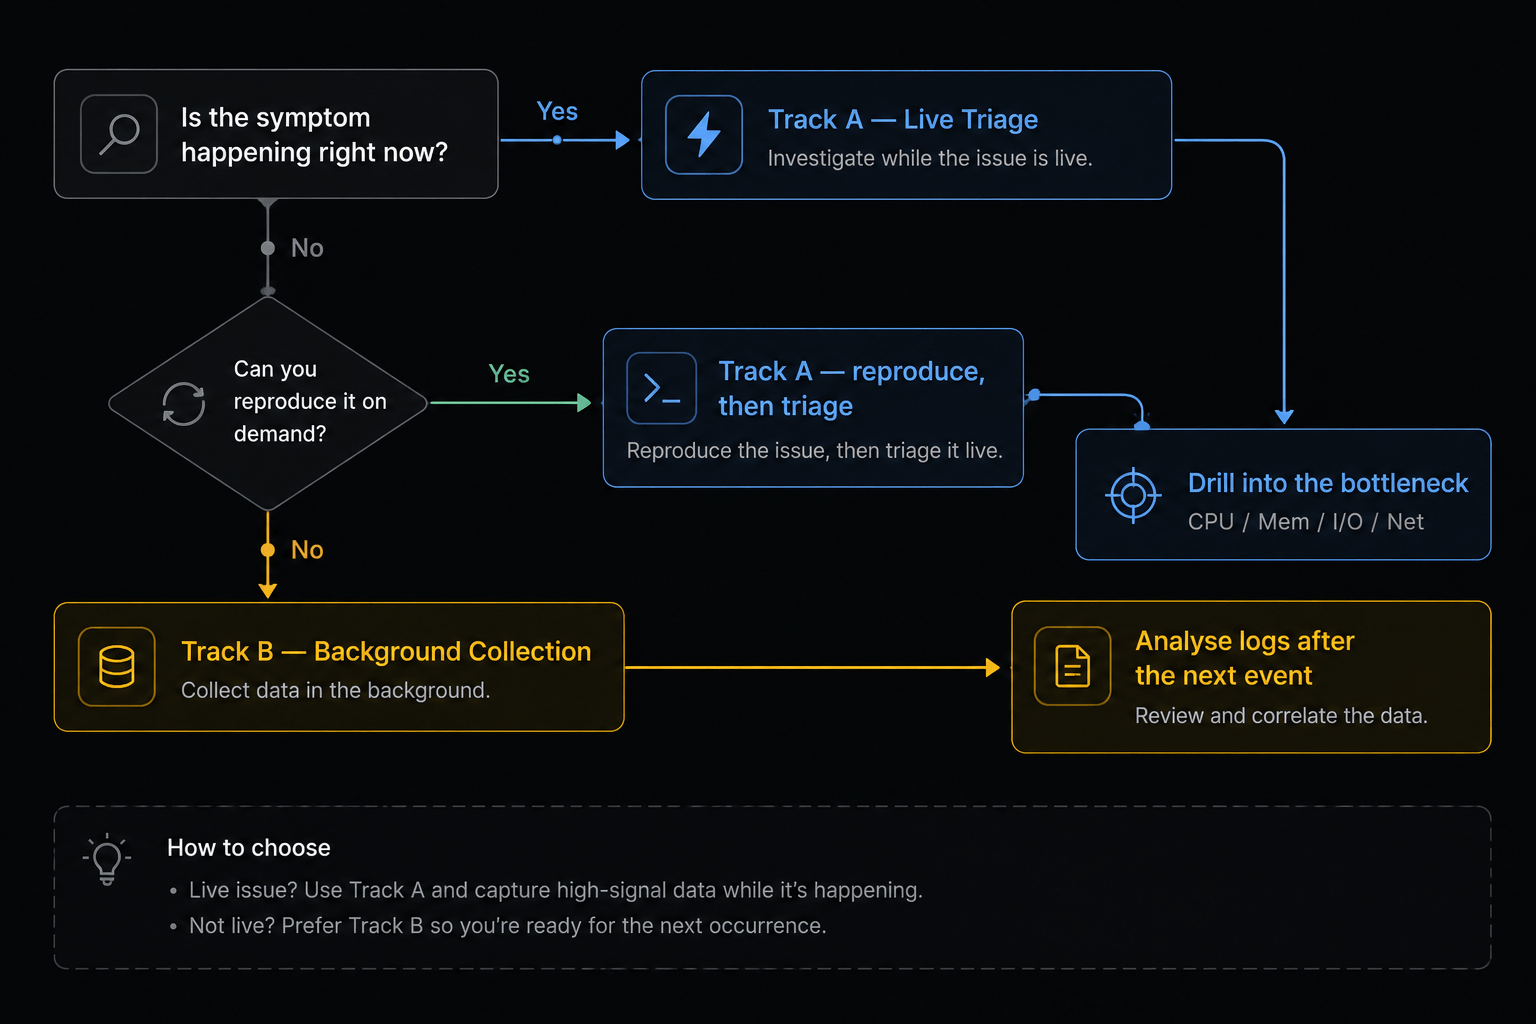
Recommended companion: LinuxAiOPerf
Before diving into individual tools, there is a tool worth installing on every box where you investigate performance: LinuxAiOPerf — an all-in-one Linux performance data collector that wraps most of what’s described below into a single, controllable session.
It is particularly powerful for Track B (Background Collection) because it:
- Starts and stops
vmstat,iostat,pidstat,mpstat,sar,ps,/procsnapshots, and more with a single command - Saves everything to a timestamped directory ready to attach to a ticket or share with engineering
- Handles long unattended runs without filling the disk
- Produces output that is easy to diff between “good” and “bad” windows
LinuxAiOPerf as your default collector. Reach for raw vmstat / iostat / pidstat only when you need something it does not capture, or when you want to watch something live in a second terminal.# Download
wget https://raw.githubusercontent.com/samatild/LinuxAiOPerf/main/build/linux_aio_perfcheck.sh
# Make executable
chmod +x linux_aio_perfcheck.sh
# Run (interactive mode)
sudo ./linux_aio_perfcheck.sh
Track A — Live Triage
You’re on the box, the problem is visible. Goal: identify the dominant bottleneck (CPU, memory, I/O, or network) in under 60 seconds, then drill in.
The 60-second triage
Run these in order. Stop as soon as one clearly points at a culprit.
# 1. Overall load and "is anything obviously wrong?"
uptime
dmesg -T | tail -50
# 2. CPU + run queue + swap + I/O wait, sampled every second
vmstat 1 5
# 3. Per-CPU breakdown (is one core pegged? is it user, system, or iowait?)
mpstat -P ALL 1 3
# 4. Top processes by CPU and memory
pidstat -u 1 3
pidstat -r 1 3
# 5. Disk pressure
iostat -xz 1 3
# 6. Memory truth
free -h
Reading the first signs
Signal in vmstat 1 | Likely bottleneck |
|---|---|
r consistently > number of CPUs | CPU saturation (run queue) |
b > 0 with high wa | I/O bottleneck (processes stuck in D-state) |
si / so > 0 | Memory pressure — swapping |
sy very high (>30%) | Kernel work — syscalls, contention, interrupts |
us very high with low id | User-space CPU — application is the culprit |
ps — Process snapshot
ps aux # All processes: user, CPU, MEM, state, command
ps auxf # Same, with ASCII process tree
ps -eo pid,ppid,stat,comm # Custom columns: PID, parent, state, name
ps -eo pid,ppid,stat,wchan,args # Add wait-channel (what kernel fn it's blocked in)
# Filter by name
ps aux | grep nginx
# Show a specific PID
ps -p <PID> -o pid,ppid,stat,vsz,rss,comm
# Find processes in bad states
ps aux | awk '$8 ~ /^[DZ]/' # D-state (uninterruptible) or zombies
STAT column decoded
| Code | Meaning |
|---|---|
R | Running or runnable (on CPU or in run queue) |
S | Interruptible sleep (waiting for event — can receive signals) |
D | Uninterruptible sleep (waiting on I/O — cannot be killed) |
T | Stopped (SIGSTOP or debugger) |
Z | Zombie (exited, waiting for parent to call waitpid) |
+ | Foreground process group |
s | Session leader |
l | Multi-threaded |
/proc/<PID>/wchan to see what they’re waiting on./proc — Live kernel state
# Process status (state, memory, threads, signals)
cat /proc/<PID>/status
# Key fields
grep -E 'State|VmSize|VmRSS|VmSwap|Threads|SigCgt' /proc/<PID>/status
# What kernel function is the process sleeping in?
cat /proc/<PID>/wchan
# Full command line
cat /proc/<PID>/cmdline | tr '\0' ' '
# Open file descriptors
ls -la /proc/<PID>/fd
# Memory map (virtual address space)
cat /proc/<PID>/maps
# Detailed per-region memory accounting
cat /proc/<PID>/smaps_rollup
# System-wide memory
grep -E 'MemTotal|MemAvailable|SwapTotal|SwapFree' /proc/meminfo
Key /proc/meminfo fields
| Field | Meaning |
|---|---|
MemTotal | Total physical RAM |
MemAvailable | RAM available for new allocations (use this, not MemFree) |
MemFree | RAM not used at all (excludes reclaimable cache) |
Cached | Page cache (reclaimable) |
SwapTotal / SwapFree | Swap space |
Dirty | Pages waiting to be written to disk |
vmstat — System-wide memory + CPU
vmstat 1 # Update every 1 second (forever)
vmstat 1 30 # 30 samples, 1 second apart
vmstat -s # Summary totals
vmstat -m # Slab allocator stats
procs --------memory--------- --swap- ---io-- -system- ------cpu-----
r b swpd free buff cache si so bi bo in cs us sy id wa
| Column | Meaning |
|---|---|
r | Processes in run queue (waiting for CPU) |
b | Processes in uninterruptible sleep (D state) |
swpd | Virtual memory used (kB) |
free | Idle memory (kB) |
si | Swap-in rate (kB/s — pages read from disk) |
so | Swap-out rate (kB/s — pages written to disk) |
bi / bo | Blocks in/out per second |
us / sy / id / wa | CPU user / kernel / idle / iowait % |
si / so > 0 means you’re swapping. wa > 20% means I/O is the bottleneck. r > CPU count = run-queue saturation.pidstat — Per-process statistics (sysstat)
# Install sysstat if needed
sudo apt-get install -y sysstat # Debian/Ubuntu
sudo dnf install -y sysstat # RHEL/Fedora
sudo zypper install -y sysstat # SUSE
pidstat -u 1 # CPU usage
pidstat -r 1 # Memory (RSS, VSZ)
pidstat -d 1 # Disk I/O per process
pidstat -w 1 # Context switches
pidstat -urd 1 # All metrics combined
pidstat -p <PID> -u 1 # Filter for one PID
pidstat -u columns (CPU)
| Column | Meaning |
|---|---|
%usr | CPU time in user space |
%system | CPU time in kernel |
%guest | CPU time in virtual machine |
%wait | Time waiting for CPU (high = CPU contention) |
%CPU | Total CPU usage |
pidstat -r columns (Memory)
| Column | Meaning |
|---|---|
minflt/s | Minor page faults per second (no disk I/O) |
majflt/s | Major page faults per second (disk read required) |
VSZ | Virtual memory size (kB) — reserved, not necessarily in RAM |
RSS | Resident Set Size (kB) — actually in physical RAM |
%MEM | RSS as % of total RAM |
RSS is real memory usage. VSZ can be much larger — virtual memory is cheap until you actually touch the pages.iostat — Disk I/O statistics
iostat -xz 1 # Extended stats, skip idle devices, 1s interval
iostat -xz 1 10 # 10 samples
iostat -h 1 # Human-readable throughput
| Column | Meaning |
|---|---|
r/s / w/s | Read / write requests per second |
rkB/s / wkB/s | Read / write throughput (kB/s) |
await | Average I/O wait time (ms) — the key latency metric |
r_await / w_await | Average read / write latency (ms) |
aqu-sz | Average queue depth |
%util | Device utilisation % — 100% = saturated |
await > 20 ms on SSD = problem. %util near 100% = bottleneck — but on multi-queue SSDs, %util can be misleading, so trust await and queue depth.free, top, htop
free -h # Human-readable
watch -n1 free -h # Refresh every second
top # Classic interactive view
htop # Colourful interactive (sudo apt install htop)
top keys: P sort by CPU, M sort by memory, 1 toggle per-CPU, d change refresh, k kill PID, q quit.
available, not free, in the free output — available includes reclaimable cache. Plain free is misleading on Linux.strace & lsof — Drilling into a single process
# What syscalls is this process making right now?
strace -p <PID>
# Count syscalls (summary mode)
strace -c -p <PID> # Ctrl-C after a few seconds
# Trace specific syscalls only
strace -e trace=read,write,open,openat,close -p <PID>
# Timestamps + time per syscall
strace -tt -T -p <PID>
# Who has this file/socket open?
lsof -p <PID>
lsof -i :443
lsof /var/log/syslog
strace slows the target process down significantly. Don’t leave it attached to a production-critical process for long.kill — Sending signals
kill <PID> # SIGTERM (15) — polite request
kill -KILL <PID> # SIGKILL (9) — cannot be caught
kill -STOP <PID> # Freeze (SIGSTOP — cannot be caught)
kill -CONT <PID> # Resume
pkill nginx # Kill by name
kill -l # List all signals
| Signal | Number | Catchable | Meaning |
|---|---|---|---|
SIGTERM | 15 | ✅ | Graceful shutdown request |
SIGKILL | 9 | ❌ | Immediate kill |
SIGSTOP | 19 | ❌ | Freeze process |
SIGCONT | 18 | ✅ | Resume |
SIGINT | 2 | ✅ | Interrupt (Ctrl-C) |
SIGHUP | 1 | ✅ | Hangup / reload config |
SIGUSR1 / SIGUSR2 | 10 / 12 | ✅ | Application-defined |
Track B — Background Collection
The symptom is intermittent. You won’t catch it live. The goal is to arm collectors before the next event and then go back and analyse the logs after it happens.
The golden rule
Option 1 (recommended): LinuxAiOPerf
# Download
wget https://raw.githubusercontent.com/samatild/LinuxAiOPerf/main/build/linux_aio_perfcheck.sh

# Make executable
chmod +x linux_aio_perfcheck.sh

# Run (interactive mode)
sudo ./linux_aio_perfcheck.sh
This is the path of least resistance for an unattended overnight collection. One command, one output directory, everything correlated by timestamp.
Option 2: Manual sysstat + tee loggers
If you can’t install anything new, the classic sysstat tools work fine. Run each one in its own tmux / screen window (or as systemd-run --unit=... units) and redirect to dated log files.
# Pick a run directory
RUN=/var/log/perfrun-$(date +%Y%m%d-%H%M%S)
mkdir -p "$RUN"

# CPU + memory + I/O + run queue, every 5s
vmstat -t 5     | tee "$RUN/vmstat.log"   &

# Per-CPU breakdown
mpstat -P ALL 5 | tee "$RUN/mpstat.log"   &

# Per-process CPU, mem and I/O
pidstat -urd 5  | tee "$RUN/pidstat.log"  &

# Disk extended stats
iostat -xtz 5   | tee "$RUN/iostat.log"   &

# Network interfaces
sar -n DEV 5    | tee "$RUN/sar-net.log"  &

# Periodic process snapshot
while true; do
  date '+=== %F %T ===' >> "$RUN/ps.log"
  ps -eo pid,ppid,stat,pcpu,pmem,rss,vsz,wchan:25,args --sort=-pcpu \
    | head -50 >> "$RUN/ps.log"
  sleep 30
done &
-t, -tt, sar’s default), which is essential for correlating across files when reviewing later.Option 3: Let sar quietly record everything
sar is the unsung hero of intermittent issues. The sysstat package ships a cron/systemd timer that writes a binary record of system activity every 10 minutes by default — you can tighten this to every minute.
# Enable and start the collector
sudo systemctl enable --now sysstat

# On most distros, tighten the sample interval:
sudo sed -i 's|^\*/10 |*/1 |' /etc/cron.d/sysstat 2>/dev/null || true
# (On systems using the systemd timer, edit sysstat-collect.timer instead)
Then, after the event, mine the history:
# CPU history for a specific day (day-of-month)
sar -u -f /var/log/sysstat/sa15

# Restrict to the window of interest
sar -u -s 03:00:00 -e 04:00:00 -f /var/log/sysstat/sa15

# Memory, swap, I/O, network, run queue, context switches
sar -r -f /var/log/sysstat/sa15
sar -S -f /var/log/sysstat/sa15
sar -b -f /var/log/sysstat/sa15
sar -n DEV -f /var/log/sysstat/sa15
sar -q -f /var/log/sysstat/sa15
sar -w -f /var/log/sysstat/sa15
Option 4: Triggered capture
For “I only need data when something is wrong” cases, gate the collection on a threshold. Example: dump rich diagnostics when load average crosses 10.
THRESHOLD=10
OUT=/var/log/perf-trigger
mkdir -p "$OUT"

while true; do
  L=$(awk '{print int($1)}' /proc/loadavg)
  if [ "$L" -ge "$THRESHOLD" ]; then
    TS=$(date +%Y%m%d-%H%M%S)
    {
      echo "=== $TS load=$L ==="
      uptime
      ps -eo pid,stat,pcpu,pmem,rss,wchan:25,args --sort=-pcpu | head -40
      cat /proc/meminfo
      vmstat 1 5
      iostat -xz 1 3
    } >> "$OUT/triggers-$TS.log"
    sleep 60   # cool-down so we don't spam
  fi
  sleep 5
done
The same pattern works for memory thresholds, D-state process counts, specific log-line matches, or any other signal.
Analysing the logs afterwards
# When did we swap?
awk 'NR>2 && ($7>0 || $8>0)' vmstat.log

# When did %iowait spike?
awk 'NR>3 && $16>20' vmstat.log     # column index depends on vmstat version

# Which processes had the biggest RSS over time?
awk '$6 > 500000' pidstat.log

# Which disks went past 20ms await?
awk '$10 > 20' iostat.log
journalctl --since=... --until=... and dmesg -T. The kernel ring buffer often shows OOM kills, hung tasks, or block-device errors that explain what the metrics were reacting to.Quick diagnostic workflow (cheatsheet)
# 1. What's using CPU right now?
pidstat -u 1 60 | tee /tmp/cpu.log

# 2. What's using memory?
pidstat -r 1 30 | tee /tmp/mem.log
awk '$6 > 100000' /tmp/mem.log          # RSS > 100 MB

# 3. Is the system swapping?
vmstat 1 10                              # watch si / so

# 4. Is disk I/O the bottleneck?
iostat -xz 1 10                          # watch await, %util

# 5. Find processes in bad states
ps aux | awk '$8 ~ /^[DZ]/'              # D-state or zombies

# 6. What is a specific process waiting on?
cat /proc/<PID>/wchan
grep State /proc/<PID>/status

# 7. How much memory is a process really using?
grep -E 'VmRSS|VmSwap|VmSize' /proc/<PID>/status
cat /proc/<PID>/smaps_rollup

# 8. Is a process leaking memory? Watch RSS over time.
watch -n2 'grep VmRSS /proc/<PID>/status'

# 9. Was there an OOM kill / hung task / disk error?
dmesg -T | grep -iE 'oom|killed process|hung task|i/o error|blocked for'
journalctl -k --since "1 hour ago" | grep -iE 'oom|hung|error'
TL;DR
- Decide first: is this Track A (live) or Track B (intermittent)? Don’t try to catch a rare event by staring at
top. - For live triage, run the 60-second sweep:
vmstat,mpstat,pidstat -urd,iostat -xz,free -h. Stop as soon as the bottleneck is obvious. - For intermittent issues, deploy
LinuxAiOPerf— or armsarplus a handful oftee’d collectors — before the next occurrence and mine the logs after. - Always correlate metrics with
dmesg -Tandjournalctl. The kernel usually tells you what the numbers were reacting to.
Related reading
- Linux Benchmarking Made Easy with Tux Toaster when you want to generate controlled CPU, memory, disk, or network load
- Streamlining Linux Diagnostics with SOSParser when you need to analyze collected support data after the fact
- Windows EVTX Export Guide if part of your investigation crosses into Windows event logs
Feedback
Was this page helpful?
Glad to hear it! Please tell us how we can improve.
Sorry to hear that. Please tell us how we can improve.